


公式サプライヤー
公式および認定ディストリビューターとして200社以上の開発元から正規ライセンスを直接ご提供いたします。
当社のすべてのブランドをご覧ください。
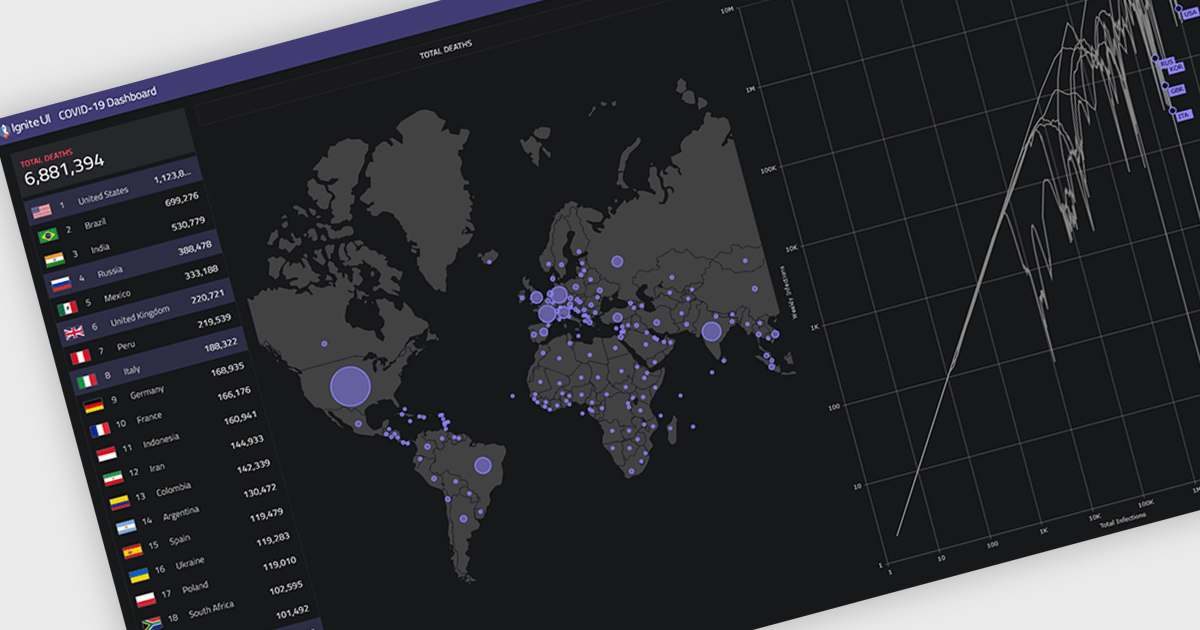
Map components allow developers to embed interactive, location-based data visualizations into applications and dashboards. By presenting data in a geographic context, they make it easier to identify patterns, monitor activity, and support faster decision-making. With features like real-time updates, data layering, and interactive navigation, maps are commonly used for tracking regional performance, visualizing logistics and routes, and monitoring live or spatial data within modern dashboards.
Several React UI suites provide map controls including:
For an in-depth analysis of features and price, visit our React chart controls comparison.
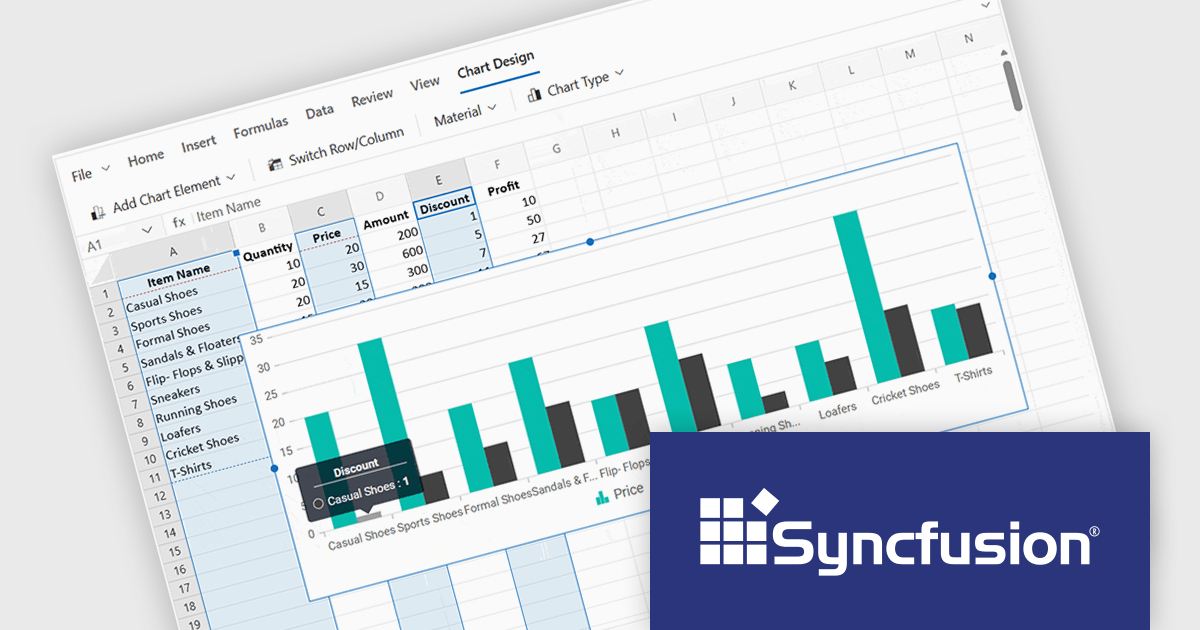
Syncfusion Essential Studio Spreadsheet Editor SDK is a library that lets developers embed spreadsheet functionality into web and desktop applications without requiring Microsoft Excel. It supports editing, formatting, and data analysis features such as cross sheet formula calculation, data binding to local and remote sources including JSON and REST, conditional cell styling, charts, data validation, worksheet protection, and workbook permissions. Available across frameworks including Blazor, React, Angular, Vue, JavaScript, ASP.NET Core and MVC, WPF and WinForms, it helps teams deliver a familiar spreadsheet experience for use cases like reporting, budgeting, and forecasting directly within their applications.
The Syncfusion Essential Studio Spreadsheet Editor SDK 2026 Volume 1 update introduces discontinuous chart range support, enabling developers to create charts from multiple non-adjacent rows, columns, or cell ranges without modifying the original data structure. This capability provides greater flexibility when working with complex, fragmented, or selectively relevant datasets, eliminating the need for manual data consolidation or duplication. It also ensures that charts remain automatically synchronized with updates across all referenced ranges, supporting more accurate, efficient, and maintainable data visualization within modern web and enterprise applications.
To see a full list of what's new in Syncfusion Essential Studio Spreadsheet Editor SDK 2026 Volume 1 (33.1.45), see our release notes.
Syncfusion Essential Studio Spreadsheet Editor SDK is licensed per developer on a one year timed subscription basis, with runtime royalty free redistribution included when the subscription is current, and includes one year of unlimited technical support and updates. See our Syncfusion Essential Studio Spreadsheet Editor SDK licensing page for full details.
Learn more on our Syncfusion Essential Studio Spreadsheet Editor SDK product page.
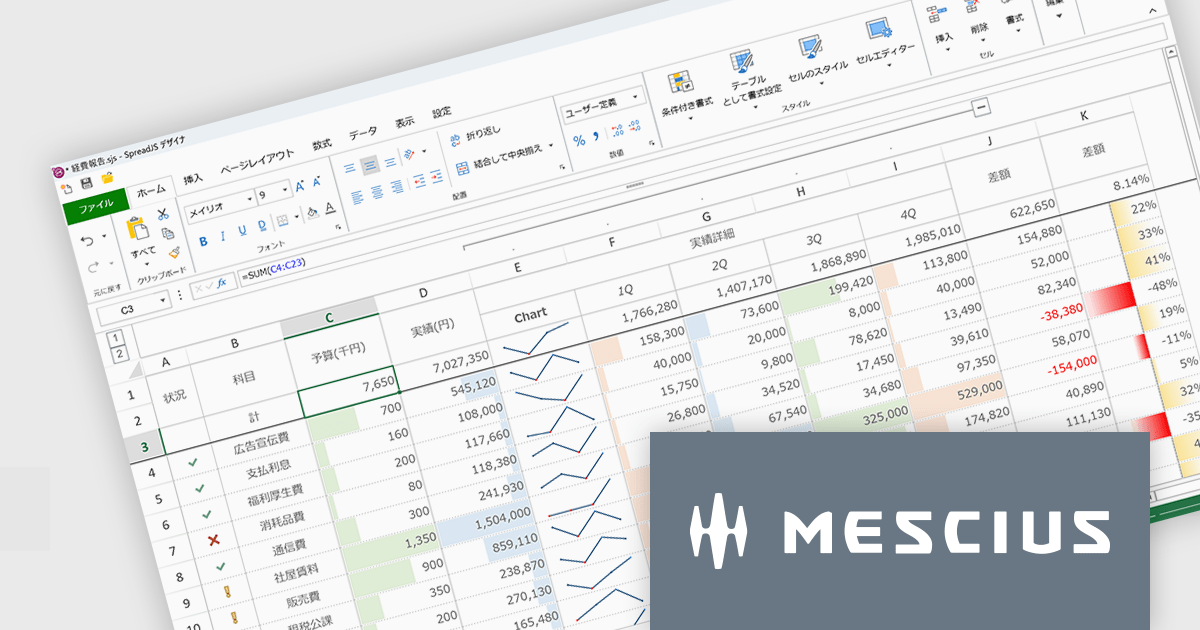
SpreadJSはWebアプリケーションでMicrosoft ExcelライクなUIと機能性を実現するために開発されたJavaScriptライブラリです。多数のExcel互換機能を備えるほか、TypeScriptでの開発や、Angular、React、Vue.jsをはじめとする主要JavaScriptフレームワークにも対応しています。付属するGUIデザイナもExcelに類似しているため、各種外観スタイルを直感的に操作できます。多くのコード量が必要な設定もノンコーディングで実現し、開発工数を大幅に削減します。
SpreadJS V19Jでは、各種AIプラットフォームのAPIと連携する機能が追加され、表計算環境におけるデータ活用が大きく進化しております。これにより、従来のように複雑な関数を扱うことなく、自然言語による指示でデータ分析や加工を実行できるようになっております。新たに追加されたAI関数として、AIへクエリを送信して分析を行う機能や、多言語翻訳、テキストの感情分析を行う機能が提供されております。これにより、従来は手作業で行っていた分析業務の効率化が可能となっております。また、数式エディタにもAI機能が組み込まれており、自然言語から数式を自動生成できるほか、作成した数式の内容を解析して説明を取得することが可能です。複雑なロジックの理解や保守性向上にも寄与いたします。
これらの機能により、SpreadJSは従来の表計算ツールから、AIと連携した高度なデータ分析基盤へと進化しており、さまざまな業務シーンでの活用が期待されます。
V19Jでの新機能一覧は、リリースノートを参考ください。
SpreadJSのライセンスは、開発ライセンスや配布ライセンス、テスト配布ライセンスなどの種類があります。なお、各ライセンスに付属されているサブスクリプション(1年間)にはテクニカルサポートや無償アップグレード等のサービスが提供されます。詳細は、SpreadJS(日本語版)のライセンス をご参考ください。
製品詳細及び販売情報は、SpreadJS(日本語版)のページをご参考ください。

ComponentSource and Optimajet have built a strong partnership focused on helping developers create, manage, and render complex web forms. OptimaJet provides flexible, developer-friendly components designed to simplify business process management, enabling teams to build scalable, efficient applications while reducing development time and cost.
At the core of their offering is Optimajet FormEngine, which helps developers to rapidly design dynamic, customizable forms with minimal effort. It supports complex logic and data handling, and provides the flexibility needed to adapt forms to specific business requirements across a wide range of industries.
This collaboration enables ComponentSource to further differentiate its product portfolio by offering advanced form-building solutions that meet modern development demands. By distributing OptimaJet’s products globally, ComponentSource ensures developers worldwide can easily access, evaluate, and implement these tools, strengthening its position as a trusted source for high-quality development components.
Learn more about Optimajet.
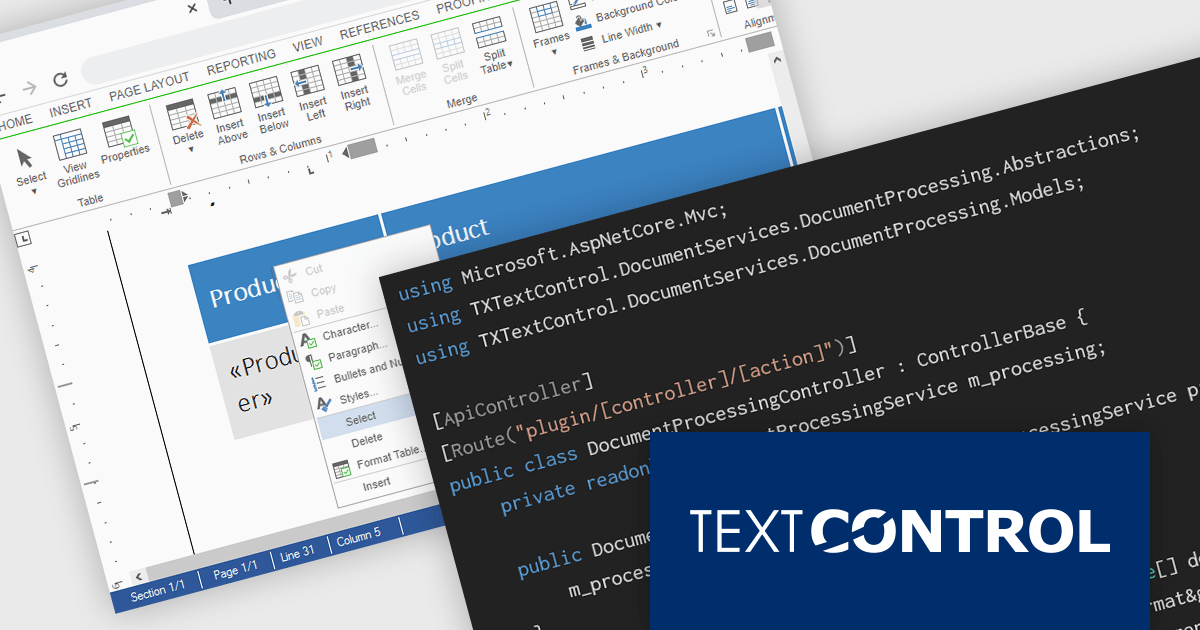
TX Text Control DS Server is a server-side document processing solution designed to integrate document generation, editing, and conversion capabilities into modern applications. Built for web, cloud, and service-based environments, it enables developers to programmatically create and manipulate rich-text documents such as DOCX, PDF, and HTML within their own systems. With APIs designed for integration into .NET applications and other backend services, it supports scenarios such as automated document generation, template-based reporting, and document workflows. By providing high-fidelity rendering and robust document processing on the server, it helps development teams incorporate powerful document functionality into enterprise applications without relying on client-side tools.
The DS Server 5.0 update introduces new Dependency Injection services for plugins, making it easier for developers to extend and integrate DS Server within enterprise applications. Using ASP.NET Core Dependency Injection, plugins can now access internal DS Server functionality through two new services. The IDocumentProcessingService provides programmatic access to document processing capabilities such as document conversion, mail merge processing, document manipulation, PDF form field extraction, and barcode generation. In addition, the IDocumentEditorSessionService enables plugins to interact with active Document Editor sessions, allowing developers to access and modify live documents, work with form fields, adjust formatting, or implement custom logic tied to editor activity. Together, these services provide a flexible way to build powerful extensions and integrate DS Server into complex systems and backend services.
To see a full list of what's new in version 5.0, see our release notes.
Text Control DS Server is licensed per server and is available as an Annual License that includes software updates. See our Text Control DS Server licensing page for full details.
For more information, visit our Text Control DS Server product page.
電話: (888) 850 9911
Fax: +1 770 250 6199


