


公式サプライヤー
公式および認定ディストリビューターとして200社以上の開発元から正規ライセンスを直接ご提供いたします。
当社のすべてのブランドをご覧ください。
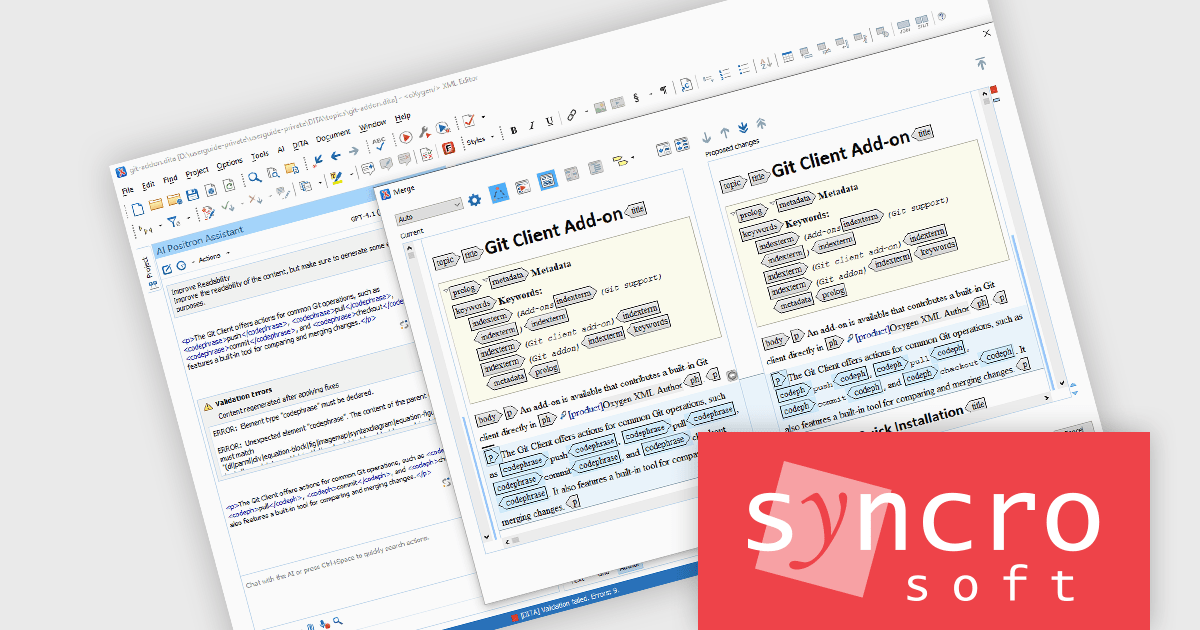
The Oxygen AI Positron Assistant Enterprise Plug-in by Syncro Soft is an Artificial Intelligence powered extension for the Oxygen XML editing suite designed specifically for technical writers. It leverages OpenAI, Microsoft Azure OpenAI Service, or Anthropic Claude to automate repetitive tasks, improve content structure and flow, and generate draft text based on user prompts. The plugin integrates seamlessly within the Oxygen environment, offering visual comparisons of suggested changes and allowing developers to control the creative process through ongoing prompts and revisions.
The Oxygen AI Positron Assistant Enterprise V6.0 release adds support for the automatic validation and correction of AI-generated content. By default, AI-generated content is automatically validated when it is inserted into your document. If errors are detected, the AI now automatically tries to correct them, ensuring that output is immediately compliant and production-ready.
To see a full list of what's new in V6.0, see our release notes.
Oxygen AI Positron Assistant Enterprise is licensed per Named user and is available as a Timed License with support and maintenance subscription. See our Oxygen AI Positron Assistant Enterprise licensing page for full details.
Learn more on our Oxygen AI Positron Assistant Enterprise product page.

TreeLists in UI suites are specialized components designed to display hierarchical, self-referencing data in a tabular format with expandable and collapsible rows. They combine the structure of a tree view with the functionality of a data grid, offering built-in features such as sorting, filtering, editing, and paging. This makes them ideal for scenarios where complex relationships must be presented clearly, such as organization charts, project task structures, file directories, or product categories. Their intuitive layout and powerful data management capabilities help streamline workflows and enhance the user experience in enterprise and business applications.
Several jQuery UI suites feature a treelist control including:
For an in-depth analysis of features and price, visit our jQuery UI Suites comparison.
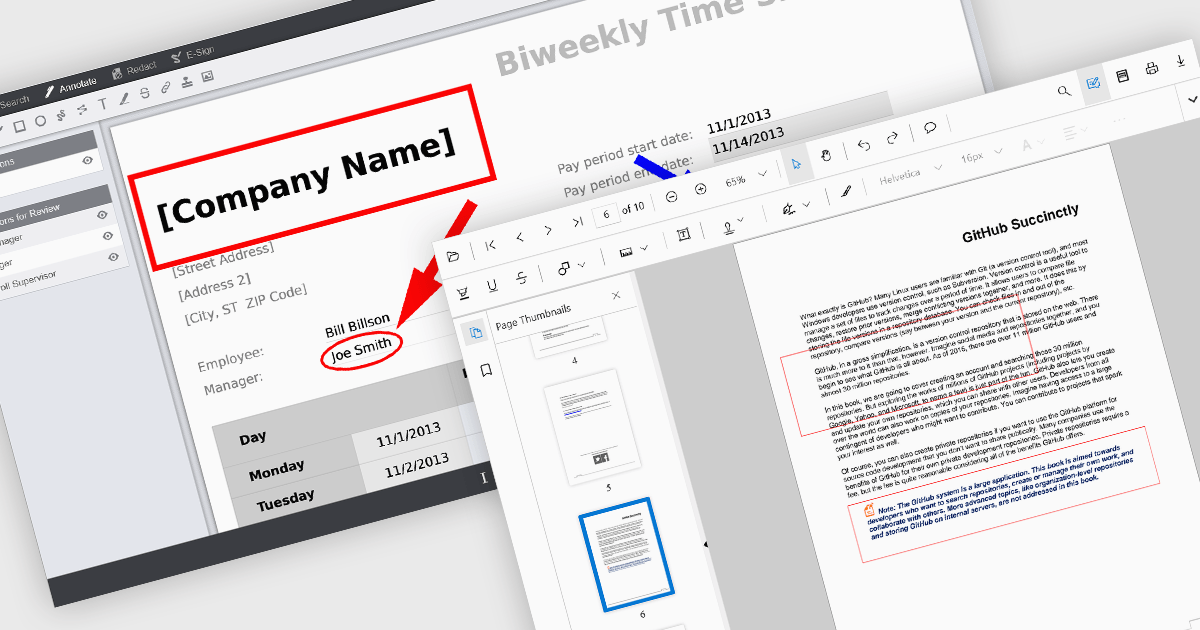
Rectangle annotations in PDF viewer components enable users to highlight, mark, or comment on specific areas within a PDF document by drawing rectangular shapes. This feature is commonly used for reviewing documents, collaborating on content, or emphasizing sections in technical or legal workflows. It enhances user interactivity within the viewer, allowing for visual references and context-specific notes without altering the original document content.
Several React PDF viewer controls offer rectangle annotations including:
For an in-depth analysis of features and price, visit our React PDF viewer controls comparison.
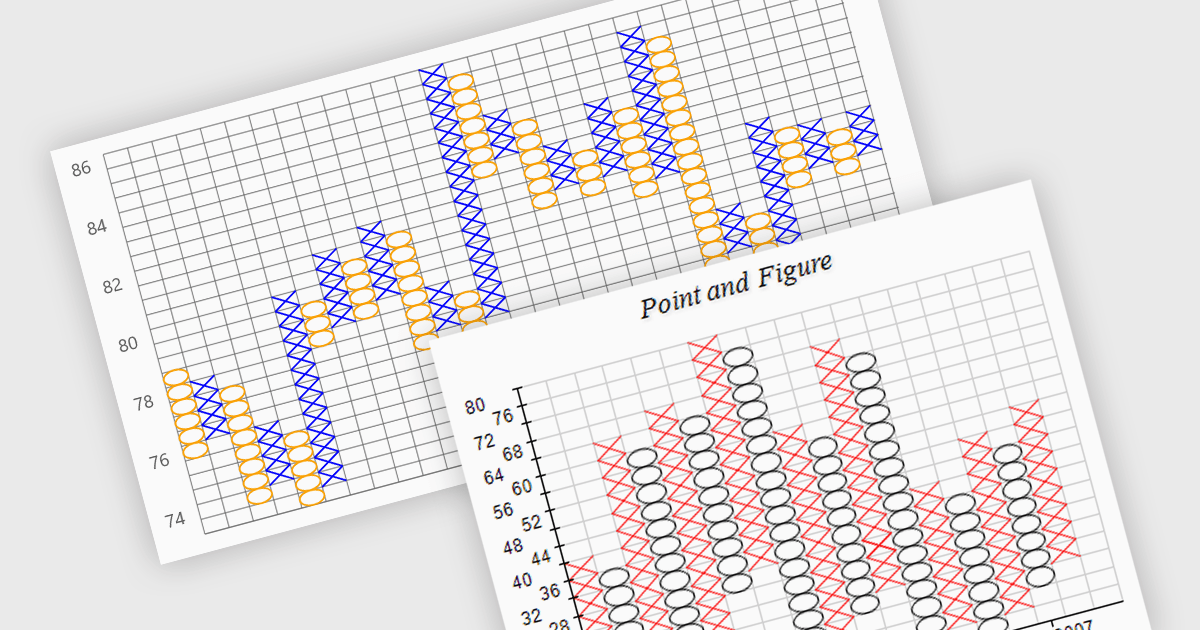
A point and figure (P&F) chart is a financial charting technique used to track price movements by plotting directional changes in price without reference to time. It focuses exclusively on significant price changes, filtering out minor fluctuations to highlight clear trends and reversals. Instead of plotting prices continuously, it uses columns of Xs and Os to represent rising and falling prices, respectively, based on predefined price increments. This chart type provides a straightforward view of supply and demand dynamics, making it particularly effective for identifying support and resistance levels, breakout patterns, and trend direction. Its simplicity helps traders and analysts focus on essential price action, reducing the noise found in traditional time-based charts.
Several .NET charting components provide you with point and figure charts, including:
For an in-depth analysis of features and price, visit our comparison of .NET chart components.
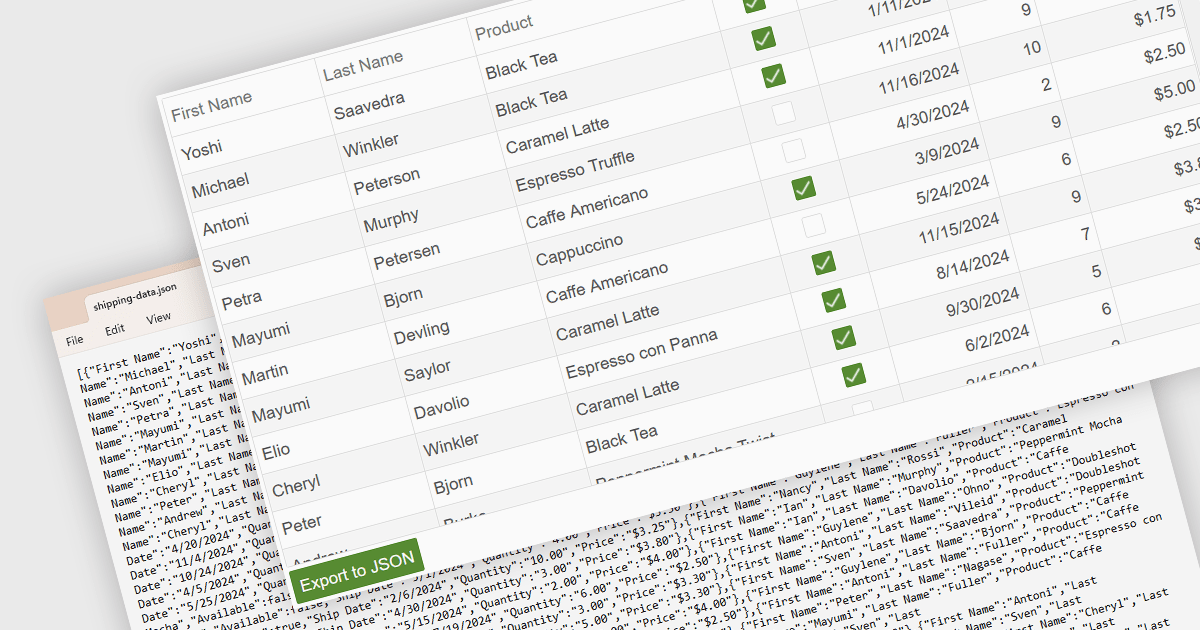
Exporting a data grid to JSON format is a common feature in modern web-based data tools that involves converting the structured data displayed in a grid, such as rows and columns representing records and fields, into JavaScript Object Notation (JSON), a lightweight, text-based format commonly used for data interchange. This process enables the grid's contents to be saved in a machine-readable structure that preserves the hierarchy and attributes of the data, making it easily consumable by web services, APIs, or other applications. The benefits of exporting to JSON include its compatibility with a wide range of programming environments, ease of integration with frontend and backend systems, and suitability for transmitting data across networked systems or persisting it for later use in client-side operations or remote storage.
Several Vue.js grid controls allow you to export to JSON, including:
For an in-depth analysis of features and price, visit our comparison of Vue.js grid controls.
電話: (888) 850 9911
Fax: +1 770 250 6199


