


公式サプライヤー
公式および認定ディストリビューターとして200社以上の開発元から正規ライセンスを直接ご提供いたします。
当社のすべてのブランドをご覧ください。
Reporting themes refers to applying consistent visual styles such as colors, fonts, and layouts across report elements to match an application's design and branding. This ensures a cohesive user experience, simplifies development through centralized style management, and supports dynamic customization such as light or dark mode. Common use cases include branded dashboards, client-specific report styling, and consistent visuals in multi-tenant SaaS platforms.
Several ASP.NET Core reporting controls offer support for themes including:
For an in-depth analysis of features and price, visit our ASP.NET Core reporting controls comparison.
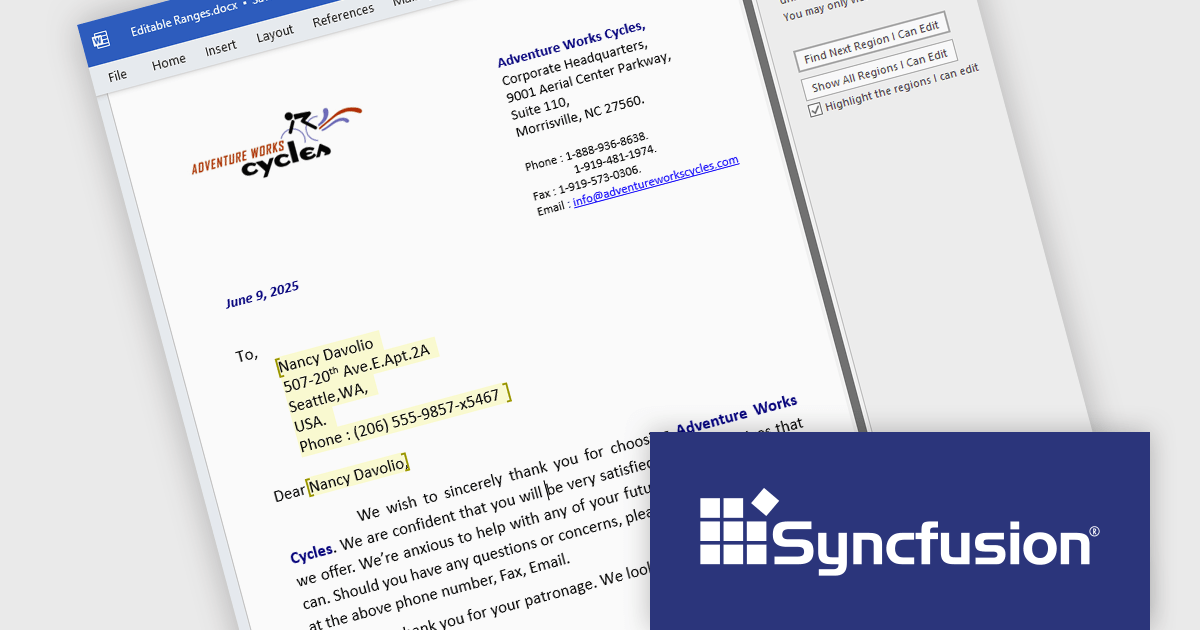
Syncfusion Essential Studio WinUI (available as part of Syncfusion Essential Studio Enterprise) is a comprehensive toolkit for building high performance native Windows desktop applications. It offers tools for crafting modern UI elements like charts, data grids, and ribbon interfaces, alongside powerful editing tools for Word, Excel, and PDF documents.
The Syncfusion Essential Studio WinUI 2025 Volume 2 release allows developers to define editable regions within protected Word documents, giving them precise control over which parts of a document users can modify. This is particularly useful for generating templates, forms, and contracts where only certain fields need to be filled in while the rest of the content remains locked. By programmatically setting these editable areas, developers can ensure document consistency, reduce the risk of accidental changes, and streamline user interaction within business applications that generate or process Word documents.
To see a full list of what's new in Syncfusion Essential Studio WinUI 2025 Volume 2 (30.1.37), see our release notes.
Syncfusion Essential Studio WinUI is available as part of Syncfusion Essential Studio Enterprise which is licensed per developer starting with a Team License of up to five developers. It is available as a 12 Month Timed Subscription License which includes support and maintenance. See our Syncfusion Essential Studio Enterprise licensing page for full details.
Learn more on our Syncfusion Essential Studio WinUI product page.
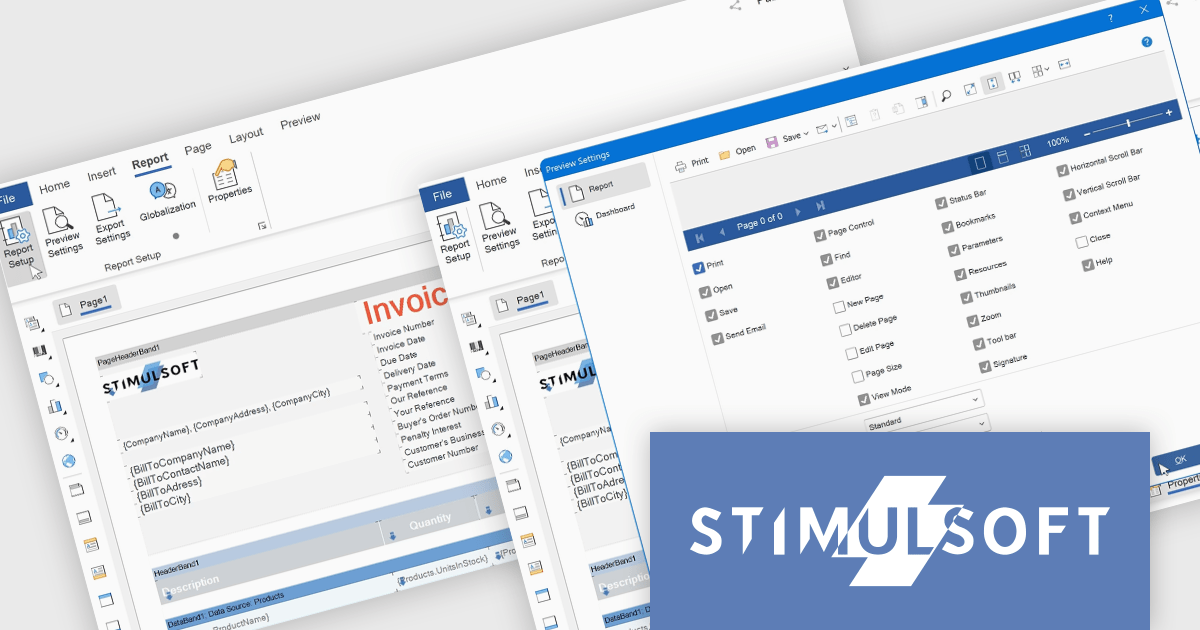
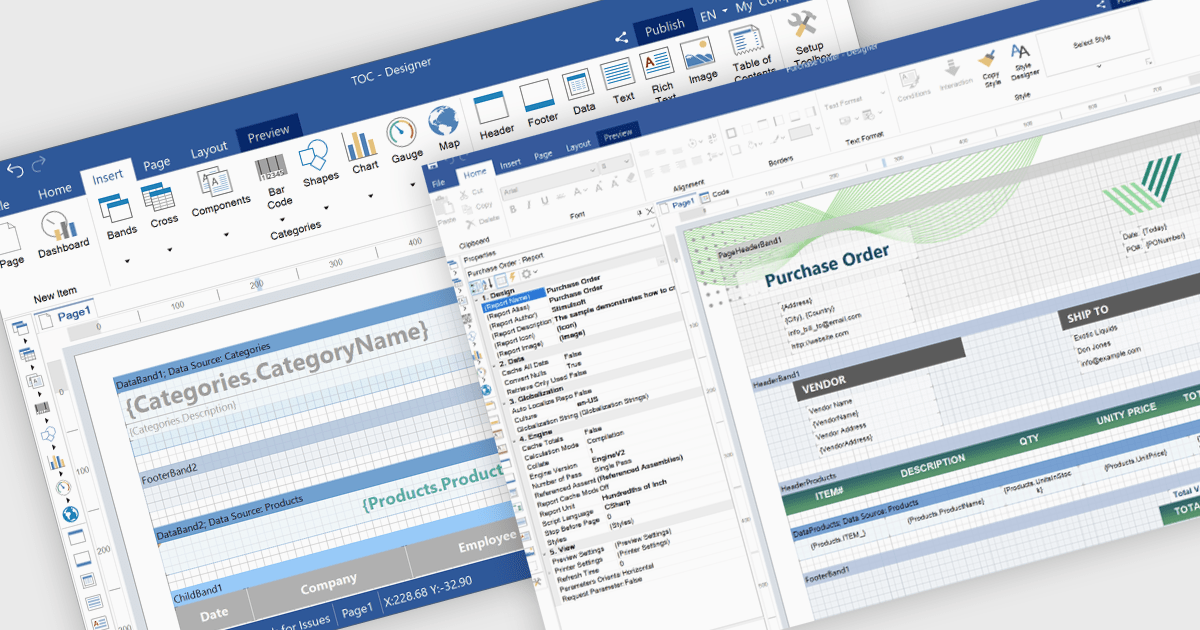
Stimulsoft Reports.WEB is a cross-platform reporting solution designed for integration within web applications. It leverages a client-server architecture for report generation, viewing, printing, and exporting directly in web browsers. Its powerful .NET report engine offers efficient report processing, a user-friendly HTML5 report designer for building reports with various data sources and visualizations, and an interactive HTML5 viewer for seamless report display within web applications. This integration allows developers to implement robust reporting functionalities without browser plugins or additional client-side dependencies.
The Stimulsoft Reports.WEB 2025.3.1 update introduces a new Report tab that improves the efficiency of report design by centralizing essential configuration tools within a single, accessible workspace. This tab integrates key functions such as Report Options, Preview Settings, Export Settings, and Globalization, allowing developers to manage the core aspects of their report templates without switching between multiple panels or views. By streamlining access to these commonly used features, the update enhances workflow speed, reduces setup complexity, and supports more consistent report output across different environments.
To see a full list of what's new in 2025.3.1, see our release notes.
Stimulsoft Reports.WEB is licensed per developer and is available as a perpetual license with 1 year support and maintenance. See our Stimulsoft Reports.WEB licensing page for full details.
Stimulsoft Reports.WEB is available individually or as part of Stimulsoft Ultimate.
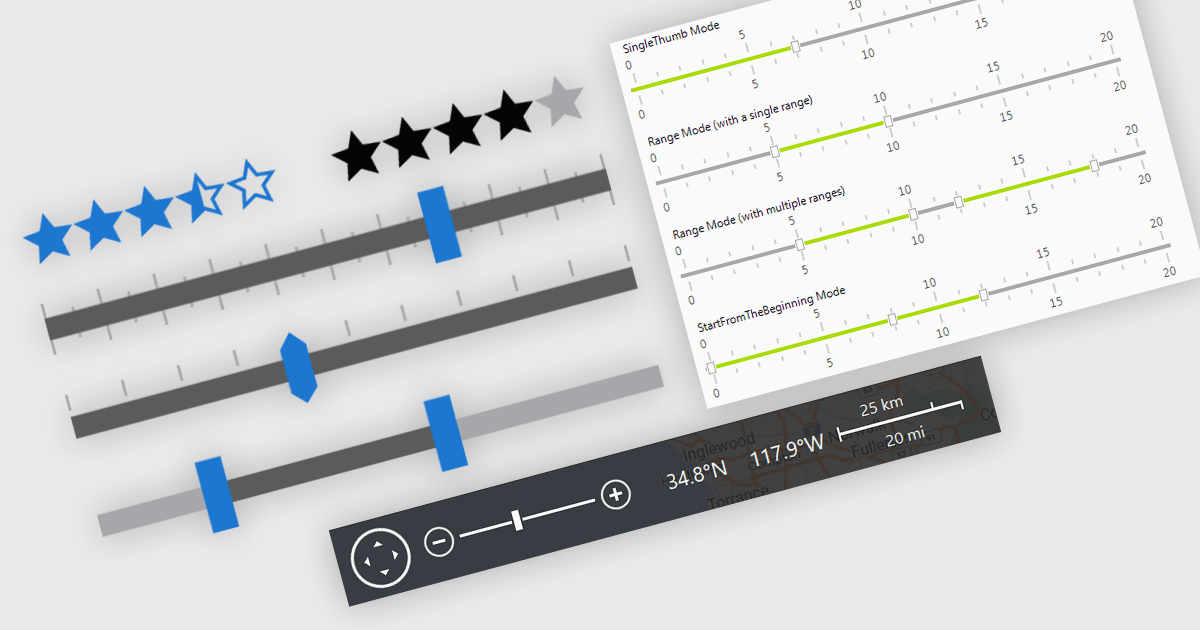
In .NET applications that require data editing, visual UI elements play a vital role in improving how users input and adjust data. For data entry such data visualization components as trackbars, range sliders, zoom controls, and rating elements offer an interactive alternative to text fields or dropdowns, making data input and feedback mechanisms more intuitive and precise. Whether it's setting numerical thresholds or filtering data sets based on user-defined limits, adjusting the view scale of charts, timelines, or graphical data displays, or quickly capturing feedback, these controls contribute to a more responsive and user-friendly interface. These components are especially valuable in scenarios that require fine-tuned input or subjective scoring, helping users make quick adjustments without disrupting the end-user's workflow.
Common features include:
For an in-depth analysis of features and price, visit our .NET data editors comparison.
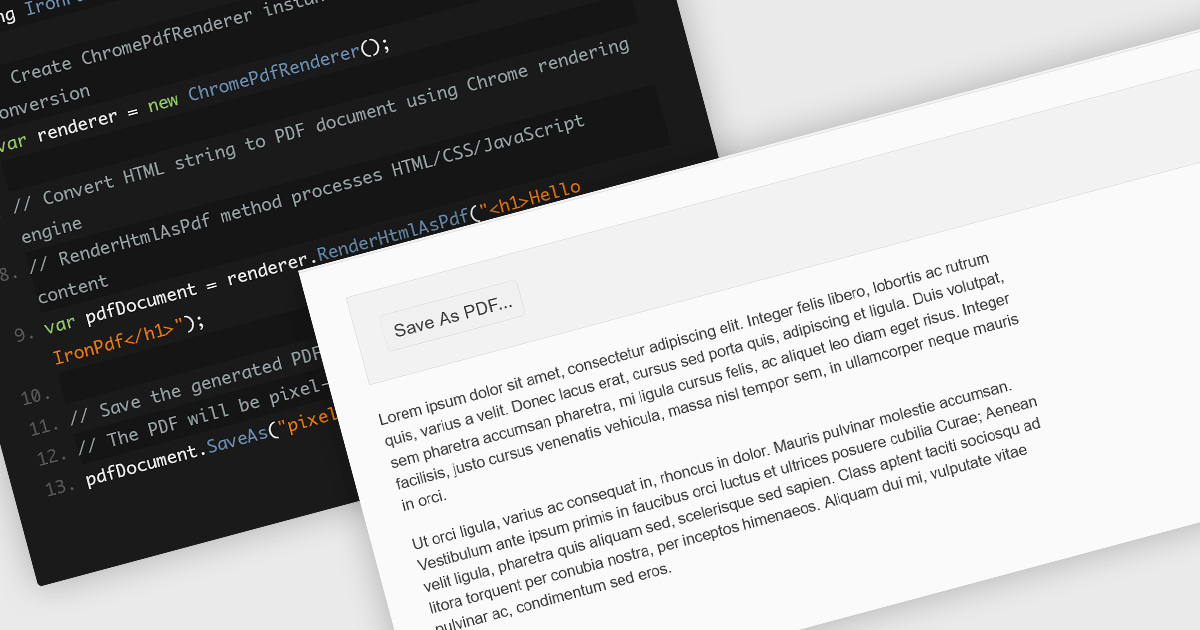
Converting HTML files to PDF within PDF component libraries offers an easy way to capture richly styled, web-based content in a fixed, shareable format. This feature typically uses a browser-like rendering engine to accurately represent CSS, images, fonts, and links, ensuring that what you see in the browser is preserved in the document. It's especially useful for generating reports, invoices, documentation, and static snapshots of dynamic web pages, combining familiarity of web-based layout with the portability and consistency of PDFs.
Several JavaScript PDF controls offer HTML fo PDF conversion including:
For an in-depth analysis of features and price, visit our JavaScript PDF controls comparison.
電話: (888) 850 9911
Fax: +1 770 250 6199


