


公式サプライヤー
公式および認定ディストリビューターとして200社以上の開発元から正規ライセンスを直接ご提供いたします。
当社のすべてのブランドをご覧ください。
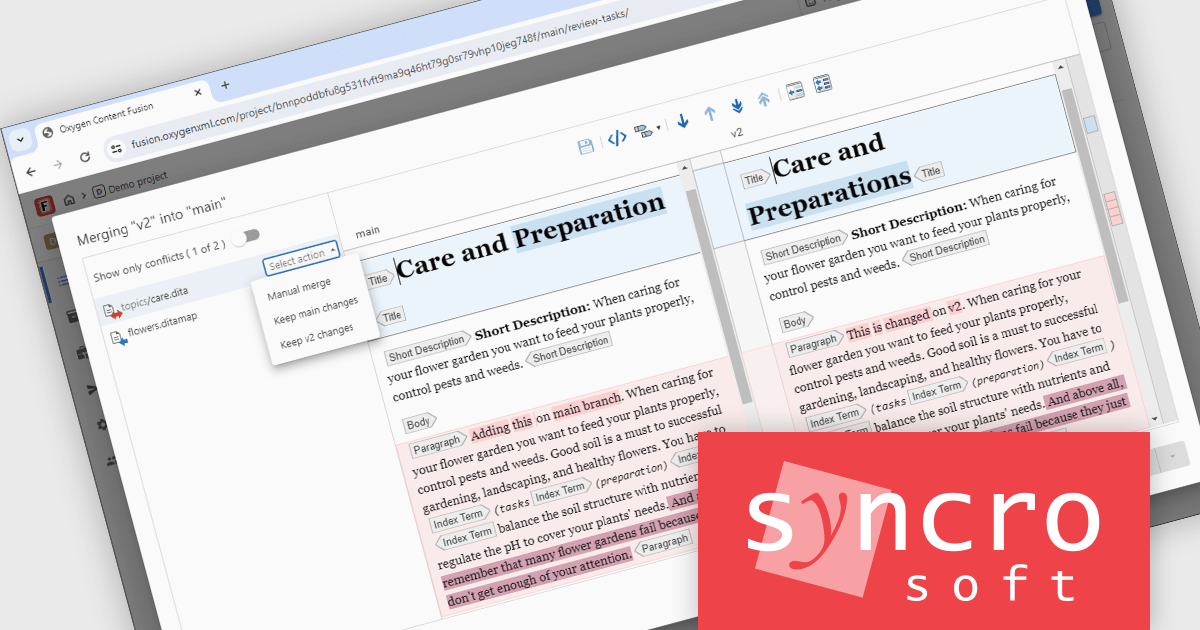
Oxygen Content Fusion by Syncro Soft is a cloud-based collaboration platform for managing and publishing DITA (Darwin Information Typing Architecture) documentation. It allows authors, reviewers, and publishers to work together on the same content in real time, and to track changes and feedback throughout the documentation process. Oxygen Content Fusion also provides a variety of tools for generating and publishing DITA content in a variety of formats, including WebHelp, PDF, and EPUB.
The Oxygen Content Fusion V8.0 release introduces a significant enhancement to its branching workflow for DITA projects. This feature now includes a streamlined action to merge a specified branch into the current one, directly within the interface. What sets this apart is the inclusion of a built-in merge tool that offers a visual comparison, moving beyond the traditional, text-heavy Git merge tools. This graphical approach allows users to more intuitively identify changes, resolve conflicts, and confirm merge outcomes, greatly simplifying complex content collaboration tasks, especially in documentation-heavy environments.
To see a full list of what's new in V8.0, see our release notes.
Oxygen Content Fusion is licensed per user and is available as an Annual license with 1 year support and maintenance. See our Oxygen Content Fusion licensing page for full details.
Learn more on our Oxygen Content Fusion product page.
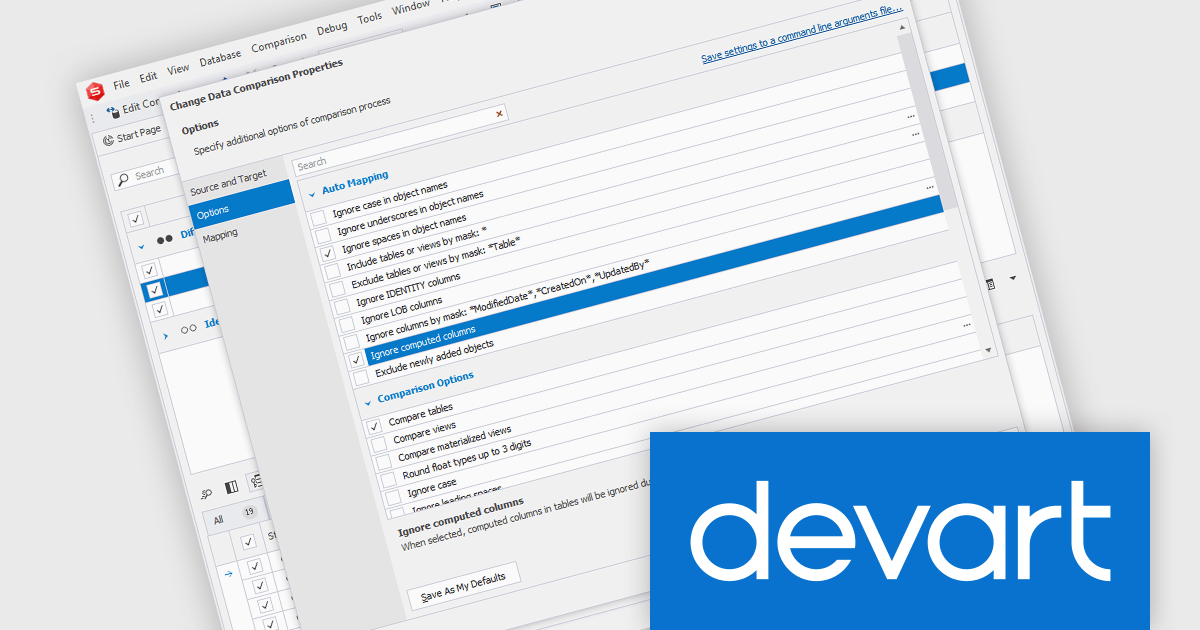
dbForge Data Compare for Oracle is a powerful tool designed to simplify database synchronization and data comparison for Oracle databases. It enables developers and database administrators to quickly identify differences between database tables, ensuring consistency across environments. With a user-friendly interface and robust automation capabilities, it streamlines the process of detecting changes, generating synchronization scripts, and integrating seamlessly into DevOps workflows.
The dbForge Data Compare for Oracle V6.0.85 release adds the option to ignore computed columns in the Data Comparison wizard, enhancing flexibility when comparing datasets. Computed columns, which derive their values from other fields, can introduce discrepancies that are irrelevant to data integrity but still impact comparison results. By allowing users to exclude these columns, dbForge Data Compare for Oracle provides more precise and meaningful comparisons, reducing noise and simplifying synchronization tasks. This feature is particularly valuable for teams working with complex schemas, as it helps focus on critical data differences without unnecessary distractions.
To see a full list of what's new in V6.0.85, see our release notes.
dbForge Data Compare for Oracle is licensed per developer and is available as an Annual or Perpetual License with a 12 month support and maintenance subscription. See our dbForge Data Compare for Oracle licensing page for full details.
dbForge Data Compare for Oracle is available individually or as part of dbForge Compare Bundle for Oracle.
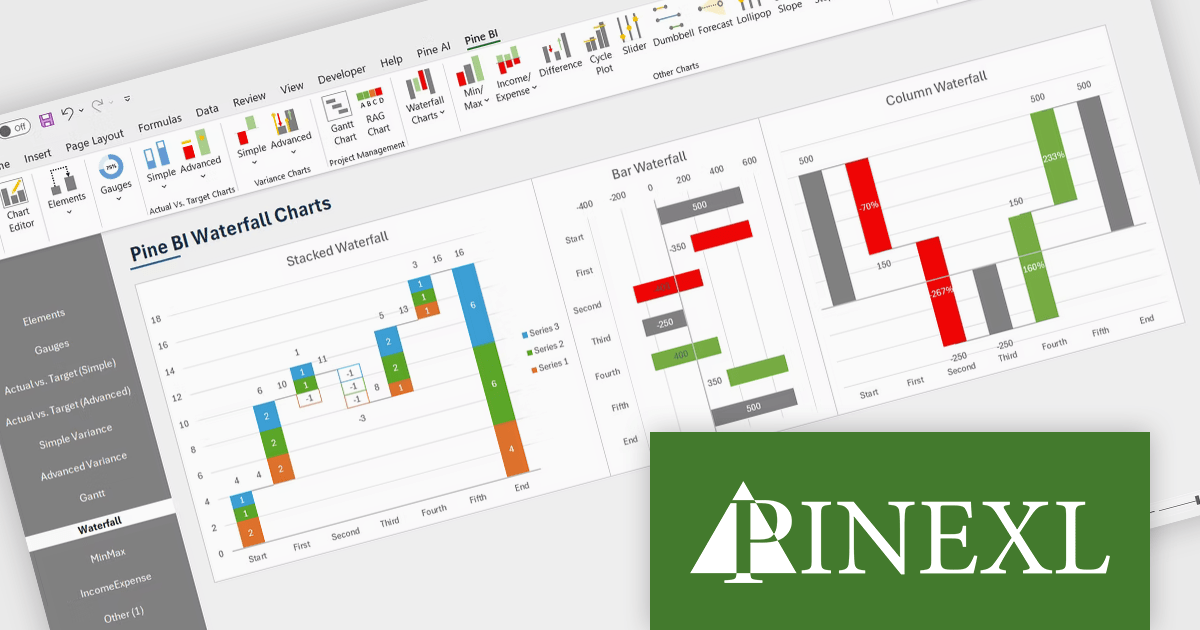
The Pine BI Excel Add-In facilitates the rapid generation of sophisticated and interactive Excel charts, enabling the transformation of standard workbooks into engaging dashboards that improve data visualization. These easily shareable visuals can also be seamlessly integrated into Microsoft Word and PowerPoint, streamlining data analysis workflows and enhancing the creation of impactful reports and presentations across various business applications.
The Pine BI Excel Add-In v2.0 update adds functionality to generate stacked waterfall charts directly within the Excel environment, providing developers with a programmatic and user-friendly method to visualize sequential data contributions to a final value. This embedded feature eliminates the need for external charting libraries or manual data manipulation, streamlining the process of creating insightful visualizations for financial analysis, performance monitoring, and comparative reporting within their Excel-based applications and solutions. Developers can leverage this capability to enhance data presentation and user understanding without requiring specialized charting expertise or reliance on separate tools.
To see a full list of what's new in v2.0, see our release notes.
Pine BI Excel Add-In is licensed annually on a subscription basis with 1, 5, and 10 seat options, requiring renewal for continued use and covering each concurrent computer, with the ability to transfer individual seat activation's as needed. See our Pine BI Excel Add-In licensing page for full details.
For more information, explore the Pine BI Excel Add-In product range.
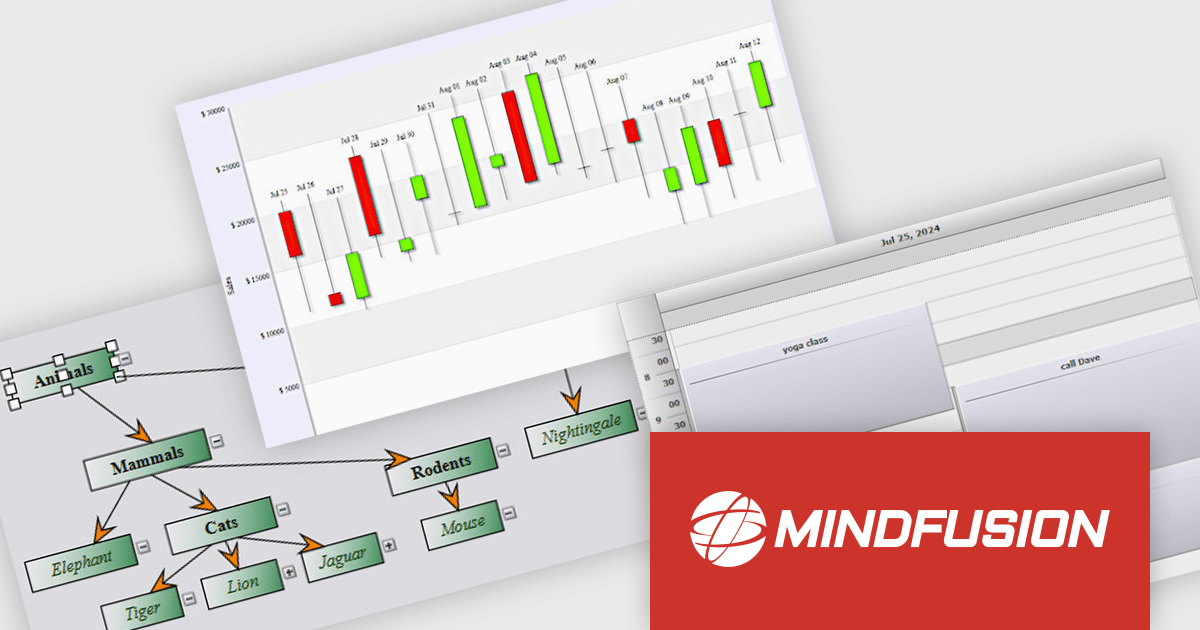
MindFusion Pack for .NET MAUI is a comprehensive collection of three powerful .NET MAUI libraries: Diagramming, Scheduling, and Charting. This suite helps developers to create visually engaging and highly functional cross-platform applications for Windows, Android, iOS, and macOS by providing a rich set of pre-built and customizable components for diverse data visualization needs.
MindFusion Pack for .NET MAUI accelerates development by providing ready-to-use, feature-rich components. The Diagramming library allows for interactive visualizations of processes and structures, while the Scheduling library offers versatile calendar and event management capabilities. Additionally, the Charting library provides comprehensive options for data presentation. With this pack, developers can efficiently create sophisticated applications with enhanced user interfaces and powerful data handling across various platforms.
MindFusion Pack for .NET MAUI is licensed per developer and is available as a perpetual license with 1 year subscription and support. See our MindFusion Pack for .NET MAUI licensing page for full details.
For more information, visit our MindFusion Pack for .NET MAUI product page.
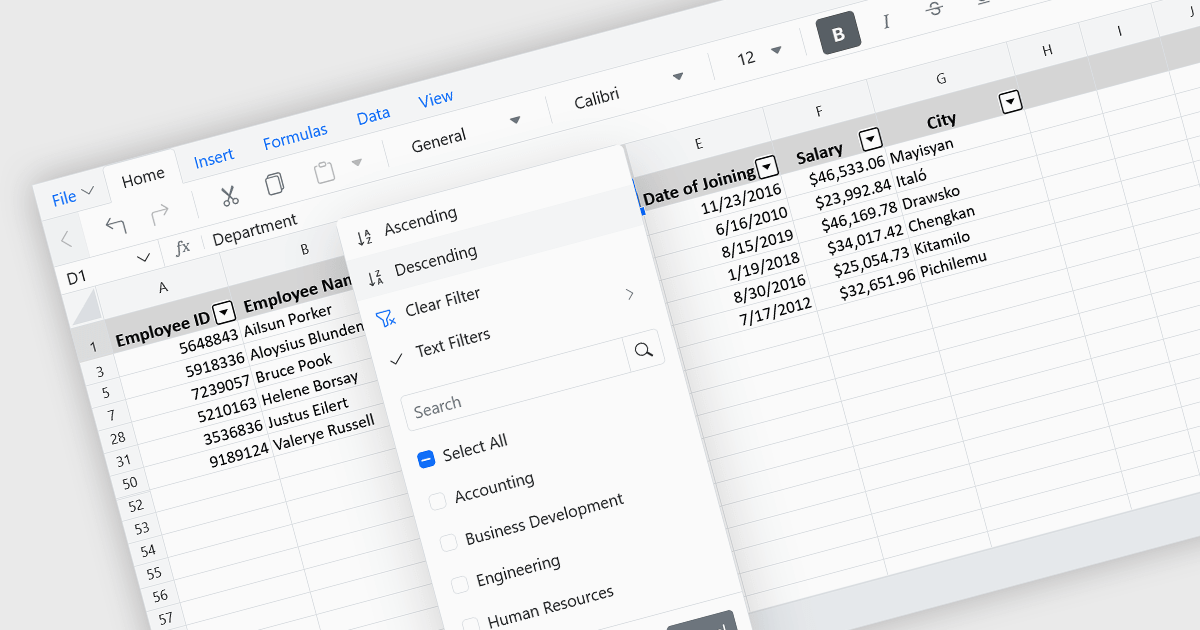
Data sorting in a spreadsheet control is a fundamental feature that enables users to rearrange data within a grid or table based on specific criteria, typically ascending or descending alphabetically or by numerical value. Sorting will usually be performed on single or multiple columns and is often integrated with other data manipulation tools like filtering, grouping, and searching. By sorting data, users can quickly locate and analyze information, identify patterns, and ensure consistency across records. Especially useful in large datasets, it improves the readability of the information and makes it more organized in preparation for decision-making, reporting, and data validation. This capability facilitates efficient data analysis, and supports better user interaction by allowing datasets to be viewed in meaningful sequences.
Several Vue.js spreadsheet controls allow you to sort data, including:
For an in-depth analysis of features and price, visit our comparison of Vue.js spreadsheet controls.
電話: (888) 850 9911
Fax: +1 770 250 6199


