


公式サプライヤー
公式および認定ディストリビューターとして200社以上の開発元から正規ライセンスを直接ご提供いたします。
当社のすべてのブランドをご覧ください。
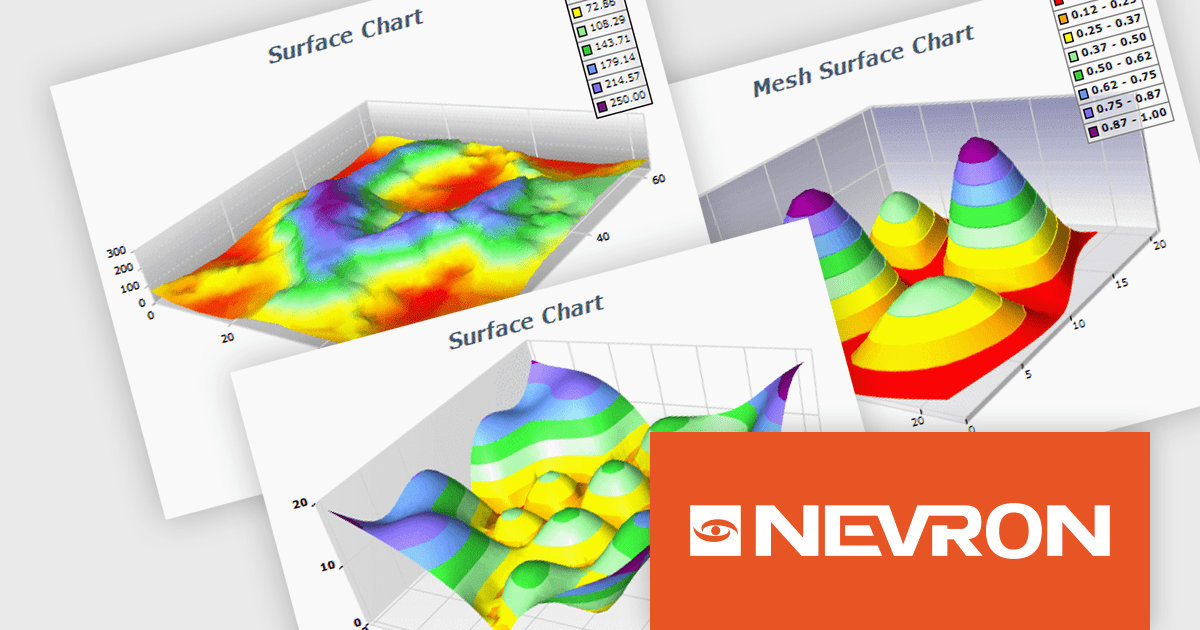
NOV Chart for .NET by Nevron is a comprehensive .NET charting component suite designed for cross-platform application development. It offers an array of 2D and 3D chart types, along with smart data labeling, an advanced chart axes model, numerous interactivity features and GPU-accelerated real-time rendering based on OpenGL. This library allows developers to seamlessly integrate rich, dynamic and interactive business, scientific, financial and presentation data visualizations into their .NET applications for more effective communication.
The NOV Chart for .NET 2024.1 update expands its surface series capabilities to include support for Grid Surface, Mesh Surface, Triangulated Surface, and Vertex Surface series types. Supporting custom colors per vertex, mesh and contour lines, flat contour rendering, real time, shader optimized rendering, and more, each series type offers unique capabilities for depicting data. This enables developers to deliver richer, more informative visual analytics, catering to a wide range of professional and scientific needs.
To see a full list of what's new in 2024.1, see our release notes.
NOV Chart for .NET is licensed per developer and is available as a perpetual license with 1 year support and maintenance. See our NOV Chart for .NET licensing page for full details.
NOV Chart for .NET is available in the following products:
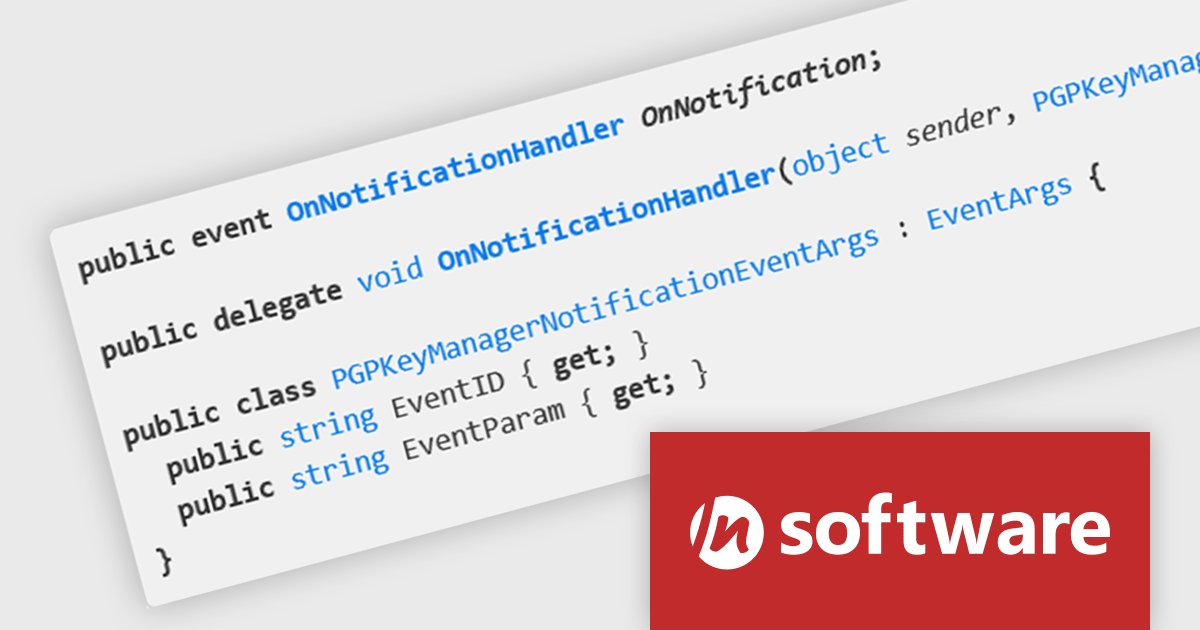
SecureBlackbox by /n software is a collection of software components designed to enhance your applications' data security. It provides functionalities for data protection through encryption and hashing, secure storage with key management, and secure transfer using protocols like SFTP and TLS. SecureBlackbox offers granular control over these features, allowing you to tailor security measures to your specific application requirements.
The SecureBlackbox 2024 update offers comprehensive support for the latest version of OpenPGP, PGP v6. This improved version introduces two key advancements: EdDSA (Edwards-curve Digital Signature Algorithm) for creating digital signatures and AEAD (Authenticated Encryption with Associated Data) for enhanced encryption. These improvements provide both stronger security and increased performance for data protection.
To see a full list of what's new in SecureBlackbox 2024, see our release notes.
SecureBlackbox is available as part of /n software Red Carpet Subscription. Red Carpet Subscription is licensed per developer and is available as a Perpetual License with a 12 month support and maintenance subscription. See our Red Carpet Subscription licensing page for full details.
SecureBlackbox is available to buy in the following products:
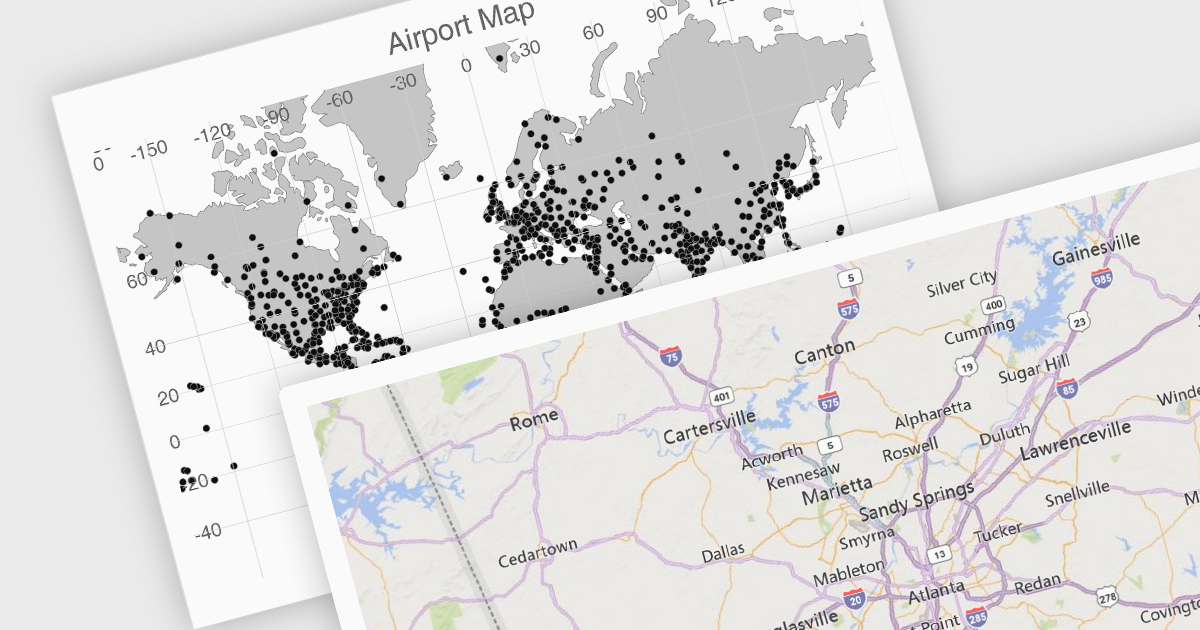
UI suites often include map components that streamline the development process for applications displaying geographical data. These components integrate seamlessly with the chosen framework, offering features like base map selection, zoom controls, and location markers. They can be customized to display real-time data visualizations, allowing users to explore trends and patterns across geographic regions. This functionality is valuable for applications in logistics, e-commerce, and any industry where location plays a key role.
Several Vue.js UI suites offer mapping functionality, including:
For an in-depth analysis of features and price, visit our comparison of Vue.js UI suites.
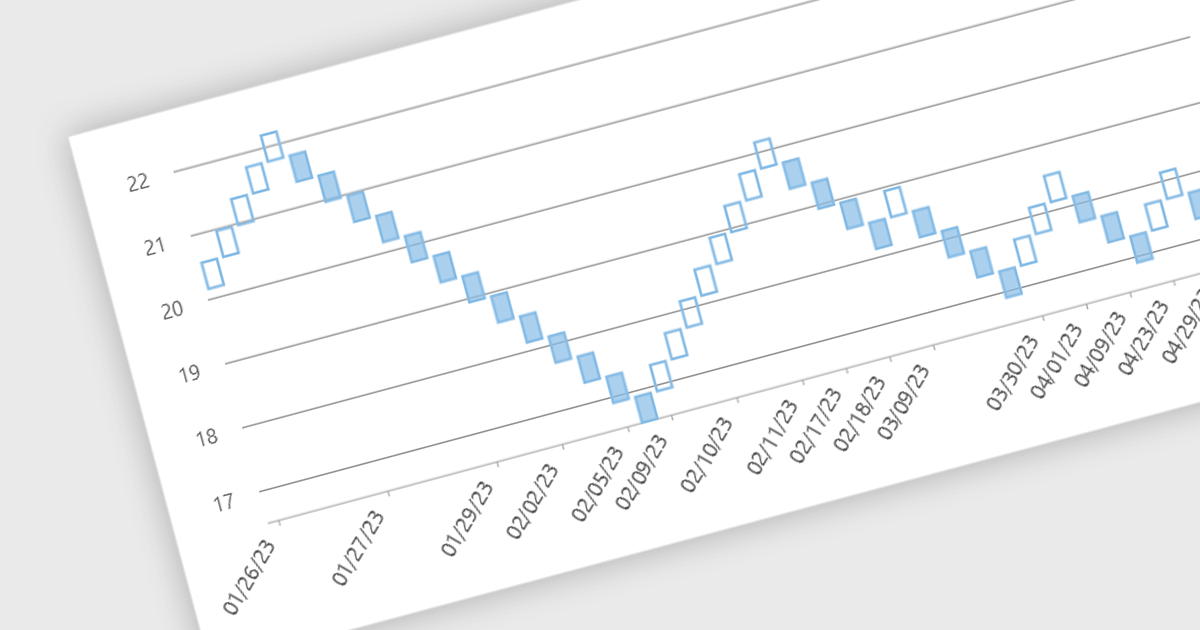
Renko charts are specialized financial charts that represent price movements with fixed-sized bricks, filtering out minor price fluctuations to highlight significant trends. These charts are particularly useful for identifying key support and resistance levels, making trend direction clearer by eliminating noise from the data. A primary benefit of Renko charts lies in their ability to simplify the visualization of market trends and price patterns, aiding developers in creating sophisticated financial applications that require precise and clear representation of market behavior. By using Renko charts, developers can enhance the analytical capabilities of their applications, providing users with powerful tools to make informed trading decisions.
Several .NET WinForms Chart controls offer a Renko chart including:
For an in-depth analysis of features and price, visit our comparison of .NET WinForms Chart controls.
Microsoft Visual Studio 2022 is a powerful Integrated Development Environment (IDE) that empowers developers to build applications for various platforms like Windows, macOS, and Linux. It offers a comprehensive suite of tools including a code editor, compiler, debugger, tester, source control integration, deployment tools, and a profiler, streamlining the entire development lifecycle.
Several .NET comms and messaging components support Visual Studio 2022, including:
For an in-depth analysis of features and price, visit our comparison of .NET communications and messaging components.
電話: (888) 850 9911
Fax: +1 770 250 6199


