


公式サプライヤー
公式および認定ディストリビューターとして200社以上の開発元から正規ライセンスを直接ご提供いたします。
当社のすべてのブランドをご覧ください。

Gantt charts, a specialized type of bar chart, are invaluable tools for project management, particularly in visualizing and tracking the timeline of tasks, dependencies, and progress. These charts are ideal for illustrating project schedules, resource allocation, and critical paths. By providing a clear and concise overview of project milestones, Gantt charts facilitate effective planning, communication, and monitoring, ultimately helping organizations achieve project goals efficiently and on time.
Several React chart controls provide Gantt charts including:
For an in-depth analysis of features and price, visit our React chart controls comparison.
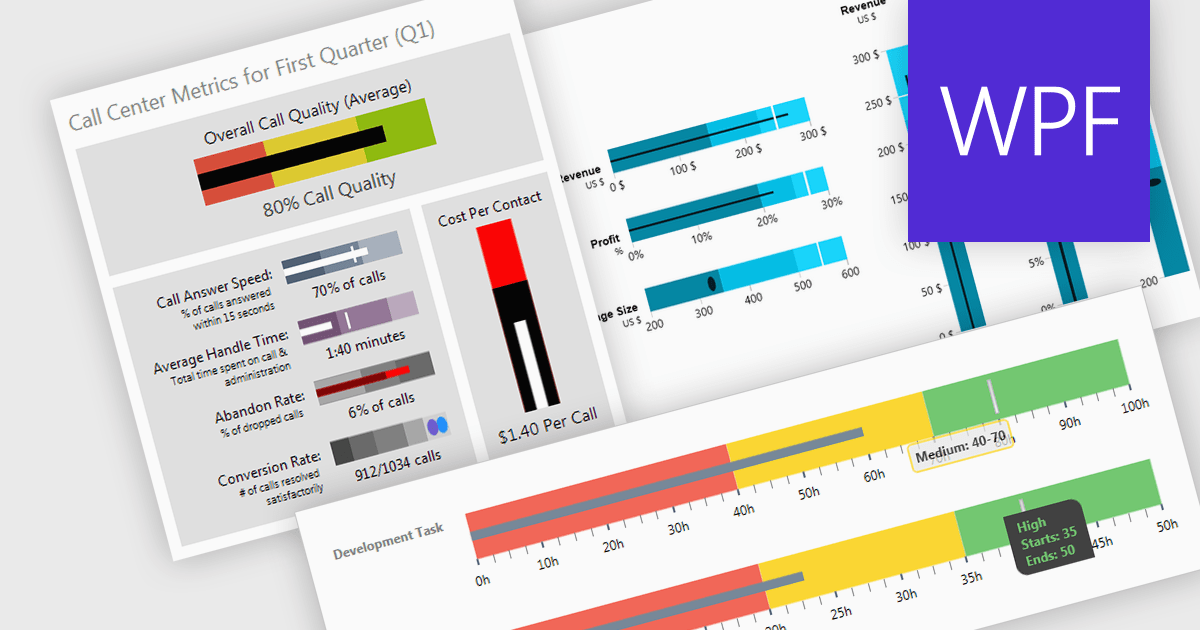
A bullet chart (or bullet graph) is a streamlined bar chart that effectively conveys key performance metrics in relation to targets. It features a single bar representing the main value, overlaid with shaded regions indicating qualitative ranges (e.g., "poor," "average," "good"), and a line marking the target. This minimalist design offers a clear, at-a-glance assessment of performance, making it well-suited for dashboards and reports where space is limited and focus on essential metrics is paramount.
Several WPF charting components support bullet graphs:
For an in-depth analysis of features and price, visit our comparison of WPF charting components.
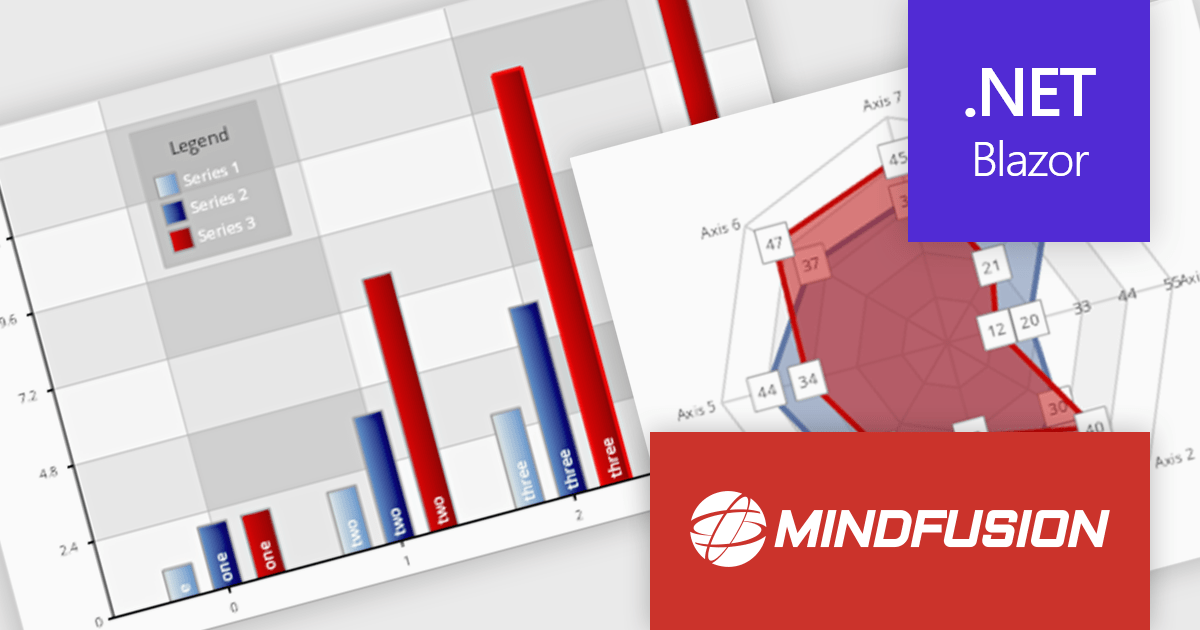
MindFusion.Charting for .NET Blazor is a robust solution that allows developers to effortlessly incorporate a diverse array of interactive and customizable charts and dashboards into Blazor applications. Supporting a wide range of chart types, from basic bar and line charts to more complex visualizations, it simplifies the creation of data-driven web applications. With flexible styling, user-friendly APIs, and smooth rendering, this library is perfect for building dynamic and visually engaging charting solutions in Blazor projects.
MindFusion Charting for .NET Blazor is ideal for building interactive, data-driven applications where dynamic visualization is key. It can be used for dashboards, reports, financial data analysis, performance tracking, and real-time monitoring. With its wide range of chart types, customization options, and user interaction features like pan, zoom, and hit testing, it enables developers to create intuitive, visually appealing interfaces for a variety of industries, including finance, healthcare, education, and business intelligence.
MindFusion.Charting for .NET Blazor is licensed per developer and is available as a perpetual license with 1 year subscription and support. See our MindFusion.Charting for .NET Blazor licensing page for full details.
For more information, visit our MindFusion.Charting for .NET Blazor product page.
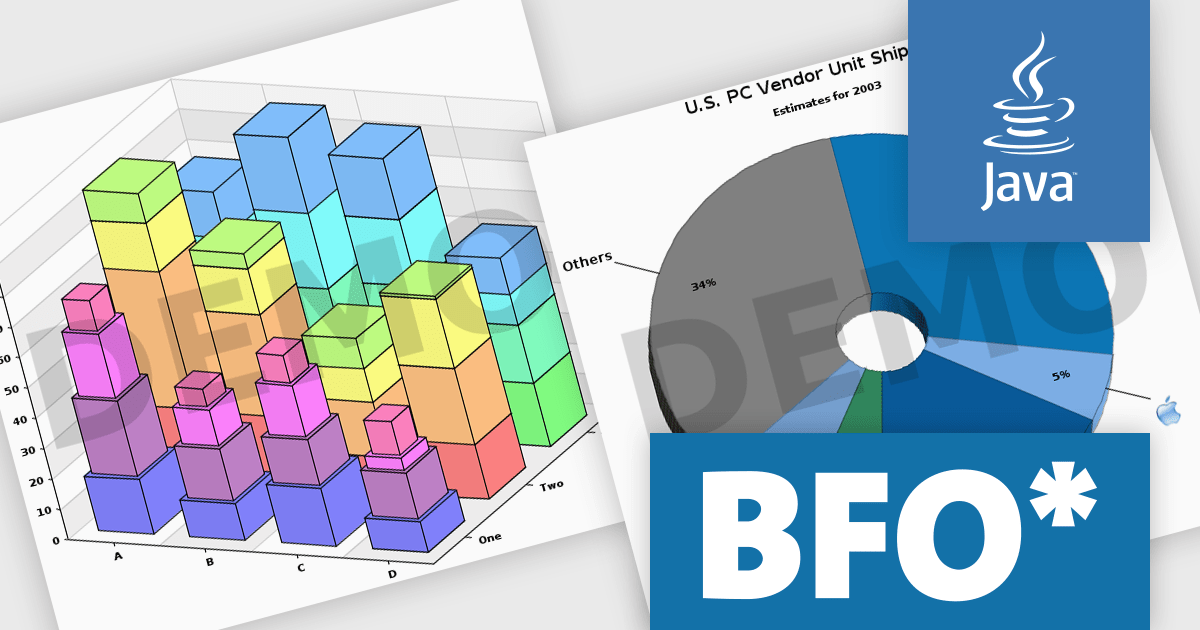
The Big Faceless Graph Library enables the creation of top-tier graphs and charts in Java. Powered by a robust 3D engine, it can generate 2D or shaded 3D pie charts, line graphs, area charts, and bar graphs from any perspective. These visuals can be exported to formats such as PNG, Flash, PDF, or SVG, delivering fast and impressive results.
The full 3D engine with an adjustable light source creates visually stunning and realistic graphs. Dynamic lighting allows users to fine-tune illumination, enhancing depth perception and clarity, making complex data easier to grasp. With control over shadows, highlights, and textures, the feature offers lifelike data representation. Customizable lighting emphasizes key details, making presentations more engaging and professional. Ideal for technical reports, financial visuals, or research, this advanced 3D engine delivers unmatched realism, helping your data stand out.
Big Faceless Graph Library is licensed per server, and is available as a perpetual license. We can supply Internal, External and OEM licenses. See our Big Faceless Graph Library licensing page for full details.
For more information, visit our Big Faceless Graph Library product page.
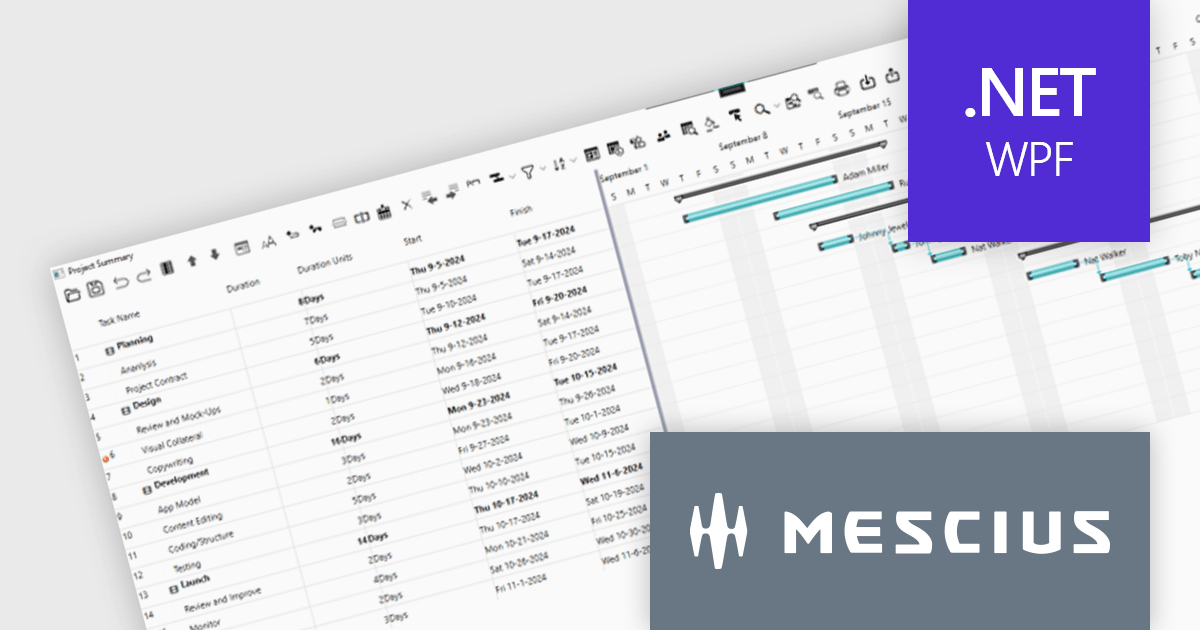
ComponentOne WPF Edition is a comprehensive suite of UI controls designed to accelerate the development of modern, visually appealing WPF applications. Offering a wide range of components, including grids, charts, input controls, and more, it empowers developers to create rich, interactive user interfaces with ease. By leveraging ComponentOne's advanced features and performance optimizations, businesses can deliver exceptional user experiences and gain a competitive edge.
In this blog, MESCIUS Associate Software Engineer Nitin Sharma demonstrates how to use theC1GanttView control included in ComponentOne Studio WPF to provide a clear view of project timelines, task durations, dependencies, and resources. You will learn the steps involved to utilize the WPF Gantt View Control in Visual Studio, including:
Sample source code is included for each step.
Read the complete blog to get started leveraging the power of Gantt Charts in your WPF apps.
ComponentOne Studio WPF is licensed per developer on a perpetual basis and includes a 12 month subscription. See our ComponentOne Studio WPF licensing page for full details.
Learn more on our ComponentOne Studio WPF product page.
電話: (888) 850 9911
Fax: +1 770 250 6199


