


公式サプライヤー
公式および認定ディストリビューターとして200社以上の開発元から正規ライセンスを直接ご提供いたします。
当社のすべてのブランドをご覧ください。
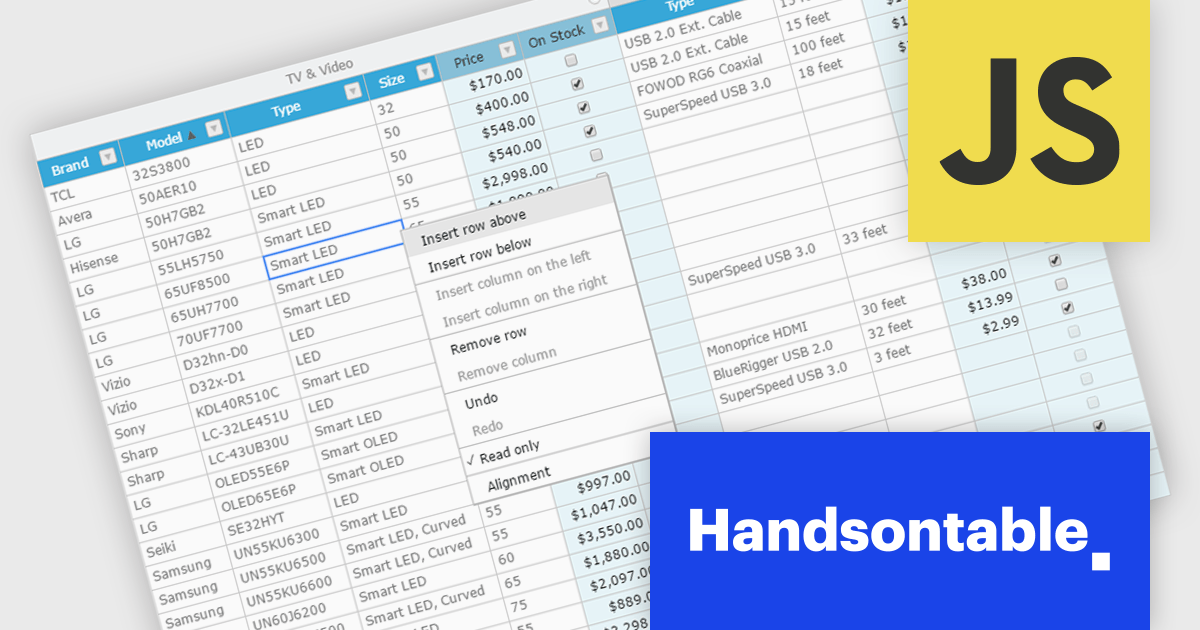
Handsontable is a JavaScript library designed to help developers build interactive data grids into their web applications. Offering a familiar spreadsheet-like interface, it allows users to edit, sort, and filter data with ease. Highly customizable and compatible with popular frameworks like React and Angular, Handsontable empowers developers to build robust data manipulation features into their web applications.
The Handsontable 15.1.0 update enhances table rendering efficiency by reusing and caching cell nodes instead of creating them from scratch during each rendering cycle. This reduces unnecessary DOM manipulations, leading to faster updates, improved responsiveness, and smoother interactions, particularly when handling large datasets. By optimizing how cells are managed, this update minimizes performance bottlenecks, allowing applications to render complex tables more efficiently while maintaining a seamless user experience.
To see a full list of what's new in version 15.1.0, see our release notes.
Handsontable is licensed per developer and is available as an Annual or Perpetual license with 1 year support and maintenance. See our Handsontable licensing page for full details.
For more information, visit our Handsontable product page.
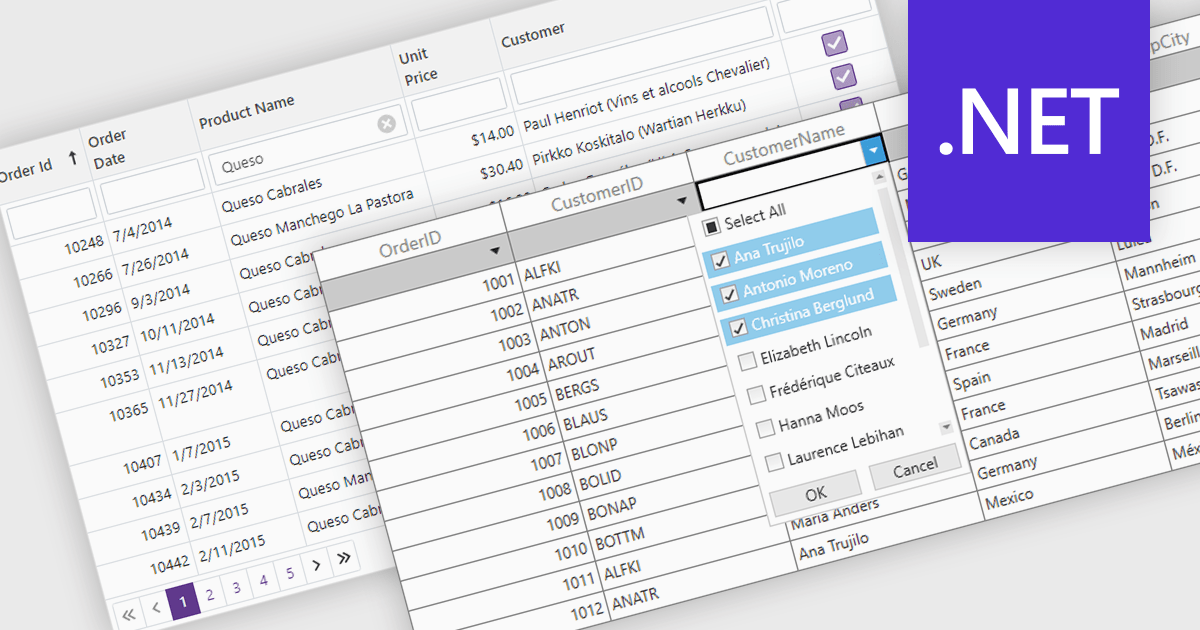
The Filter Rows feature in grids enables users to refine large datasets quickly with real-time filtering directly in the grid interface. It enhances productivity by reducing the need for manual searches, improves accuracy with precise filtering options, and streamlines workflows in .NET applications such as WinForms, WPF, and ASP.NET Core. By allowing users to filter data by text, numbers, dates, and boolean values, it simplifies data exploration and helps surface relevant information faster. This feature is especially useful in financial dashboards for transaction filtering, inventory management for quick product lookups, and CRM systems for refining customer records, making data handling more efficient and intuitive.
Several .NET grid controls offer filter row functionality including:
For an in-depth analysis of features and price, visit our comparison of .NET Grid Controls.
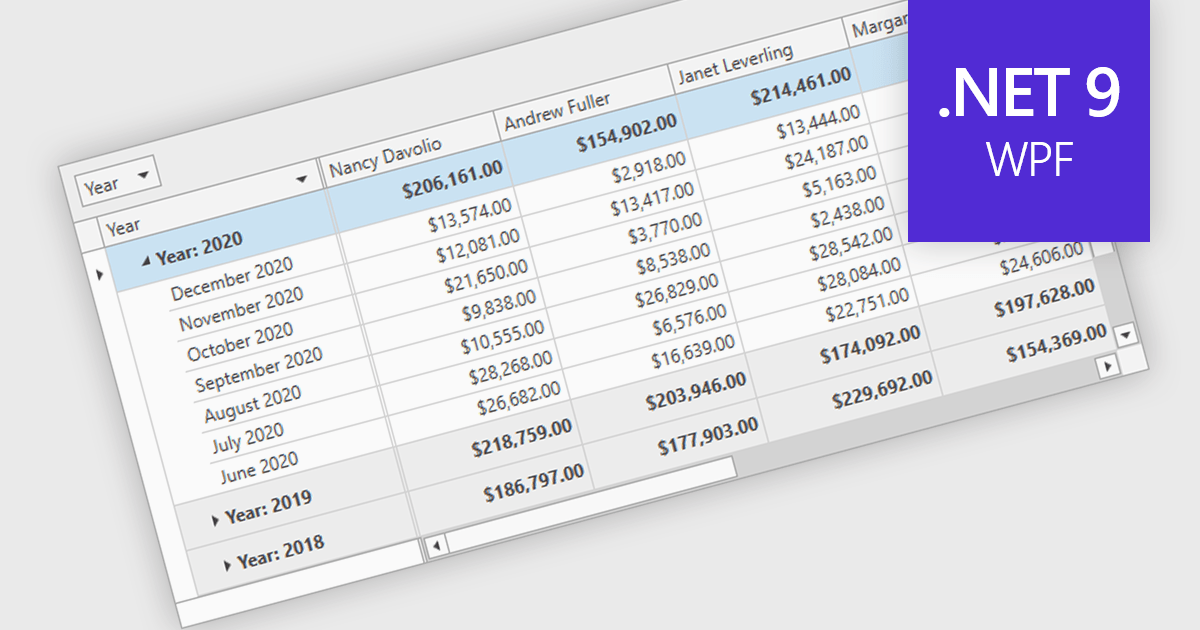
Group summary functionality enables grid components to aggregate and display key metrics such as sums, averages, and counts at the group level, offering a clear snapshot of grouped data. This feature streamlines data presentation by embedding calculated summaries directly within each group, eliminating the need for external tools or manual computations. By summarizing large datasets in real time, it improves readability, boosts decision-making efficiency, and optimizes performance through advanced data processing techniques.
Several .NET 9 WPF grid controls offer group summary functionality including:
For an in-depth analysis of features and price, visit our comparison of .NET 9 WPF Grid Controls.
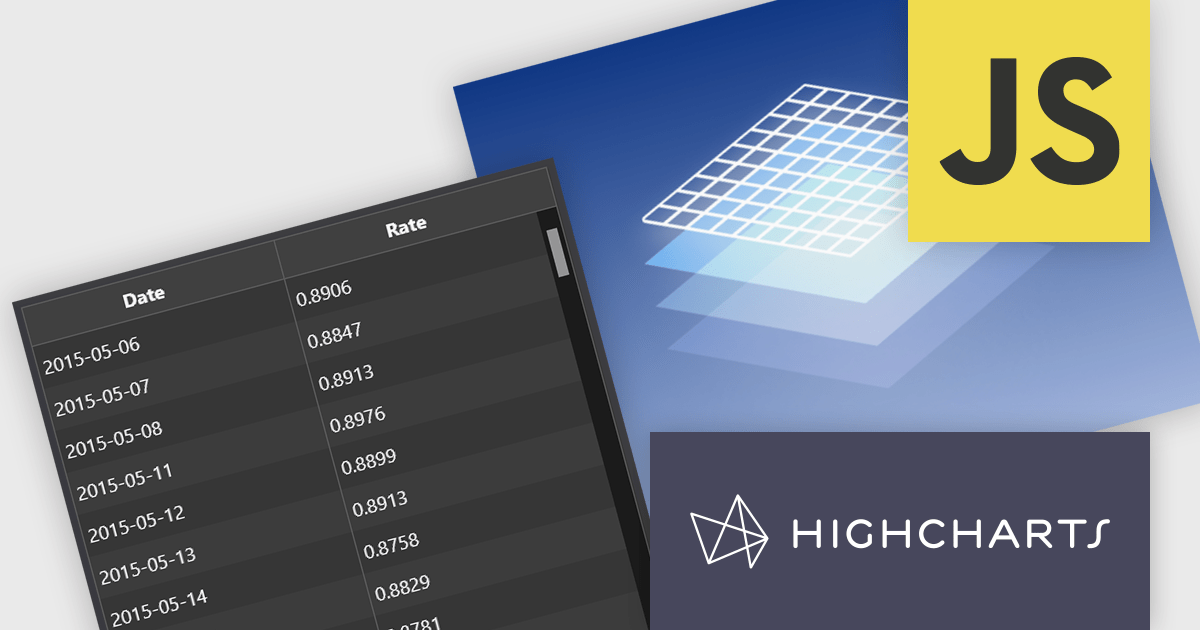
Highsoft is a Norwegian software publisher best known for Highcharts Core, a widely used JavaScript library for interactive data visualization. It specializes in developing powerful, flexible, and accessible charting solutions for developers, businesses, and data analysts. Highcharts is recognized for its seamless integration, extensive customization options, and support for a broad range of chart types, making it a popular choice for web applications and enterprise dashboards. Expanding its data visualization portfolio, Highsoft also offers Highcharts Dashboards, Highcharts Gantt, Highcharts Maps, and Highcharts Stock, catering to diverse analytical and reporting needs.
Highsoft has announced Highcharts Grid Lite, a forthcoming free solution that brings the core functionality of the data grid component in Highcharts Dashboards to a standalone, lightweight package. Designed for seamless integration into modern web applications, it offers high performance while remaining accessible and efficient. It supports WCAG-compliant interactions, ensuring usability across different environments. Its optimized row virtualization enables smooth handling of large datasets without performance degradation. Developers can easily integrate it with frameworks like React, Vue, and Angular while leveraging its intuitive API for streamlined data management and customization. With built-in CSS theming, it allows for flexible styling to match application requirements, making it a reliable solution for creating responsive, interactive tables.
Read the Highcharts Grid Lite blog post for more details on this advanced solution for building responsive, interactive data grids.
To explore the Highsoft product range, including Highcharts Dashboards, visit our Highsoft brand page.
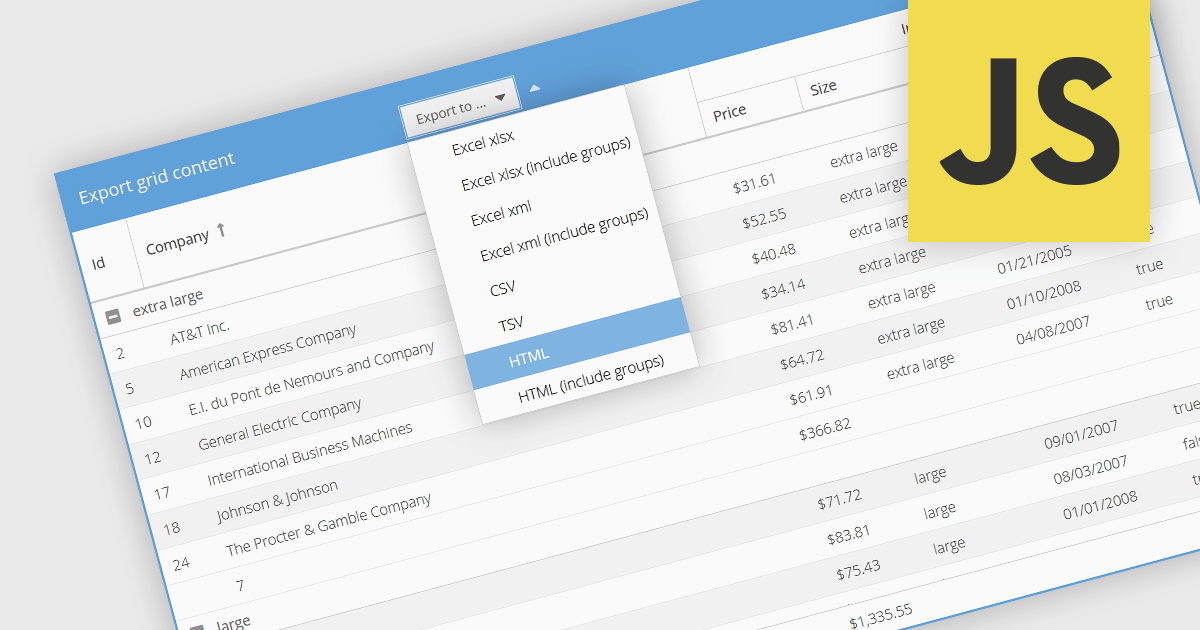
Exporting grid data to HTML is a valuable feature in grid components, enabling developers to generate structured, web-friendly representations of their datasets. This capability allows users to capture the current state of a grid, including applied filters, sorting, and formatting, and convert it into a HTML document for sharing, archiving, or further processing. By preserving the layout and styling, exporting to HTML ensures that the visual integrity of the grid is maintained, making it a convenient alternative to exporting data in static formats like CSV or Excel. The ability to export grids as HTML tables allows you to easily integrate the resultant file with web applications, and makes grid applications more useful. This provides flexibility that makes them ideal for a variety of use cases, including reporting, data dashboards, and embedding structured data within web pages.
Several JavaScript grid components allow you to export to HTML, including:
For an in-depth analysis of features and price, visit our comparison of JavaScript grid components.
電話: (888) 850 9911
Fax: +1 770 250 6199


