


公式サプライヤー
公式および認定ディストリビューターとして200社以上の開発元から正規ライセンスを直接ご提供いたします。
当社のすべてのブランドをご覧ください。
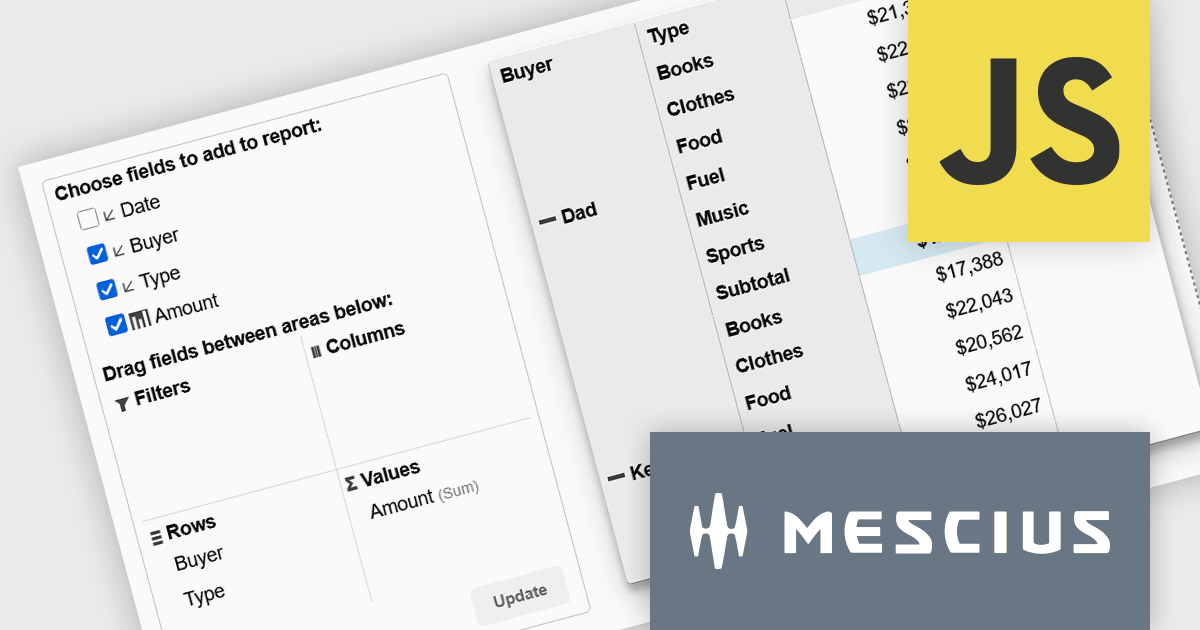
Wijmo is a cutting-edge collection of over 100 high-performance JavaScript UI controls designed for modern enterprise applications. It empowers developers to deliver superior user experiences with fully responsive, touch-friendly, and accessible components and works with any popular JavaScript framework - including Angular, React, Vue, Svelte, or pure JavaScript/TypeScript - for rapid application development across modern web and mobile platforms.
On Wednesday, July 8th at 11:00 AM EST, MESCIUS is presenting a CodeClinic Live Webinar demonstrating how to create executive-ready dashboards without requiring you to build complex aggregation logic from scratch. Joel Parks, Wijmo Product Manager for MESCIUS, will demonstrate how PivotGrid and PivotChart work together to deliver a seamless analytics experience. Key takeaways include:
Register for the Live Webinar today and mark your calendar for July 8th.
Wijmo is licensed per developer. Developer Licenses are perpetual and include 1 year Subscription which provides upgrades, including bug fixes and new features. See our Wijmo licensing page for full details.
Learn more on our Wijmo product page.
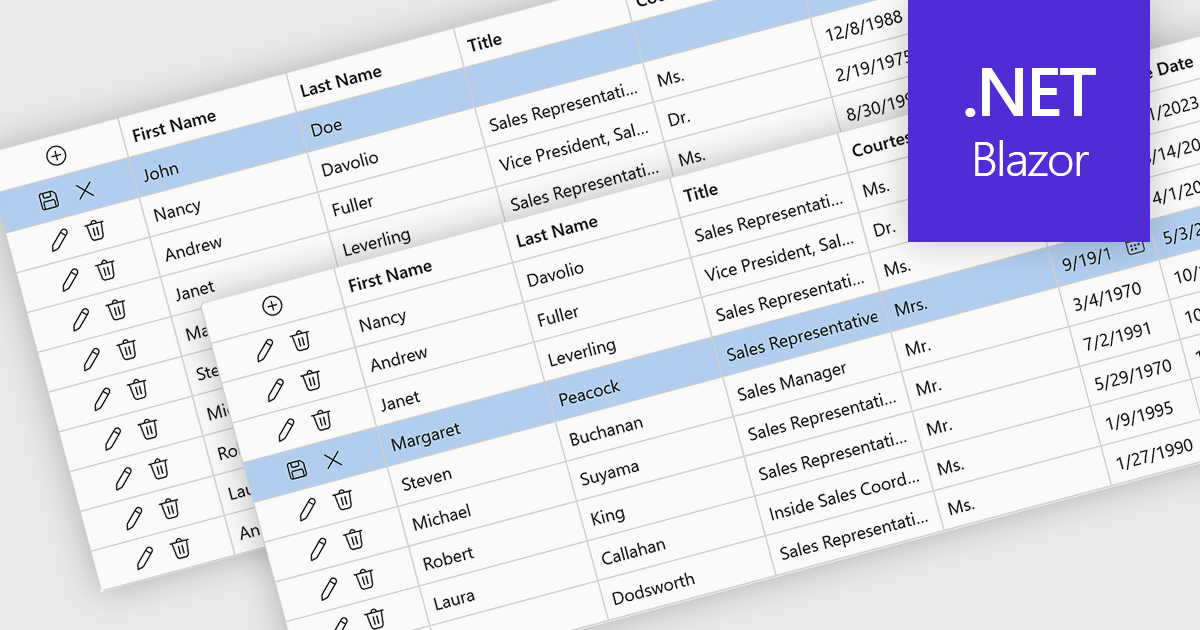
Row editing in grids allows users to update an entire record directly within a data grid, editing multiple fields at once without opening a separate form. This improves productivity by reducing clicks, keeping users in context, and making data updates faster and more intuitive. It also helps improve accuracy by allowing related information to be reviewed and validated together. Common use cases include managing customer records, updating inventory, processing orders, and maintaining employee or financial data in business applications.
Several .NET Blazor components provide data grids that allow row editing, including:
For an in-depth analysis of features and price, visit our comparison of .NET Blazor grid components.
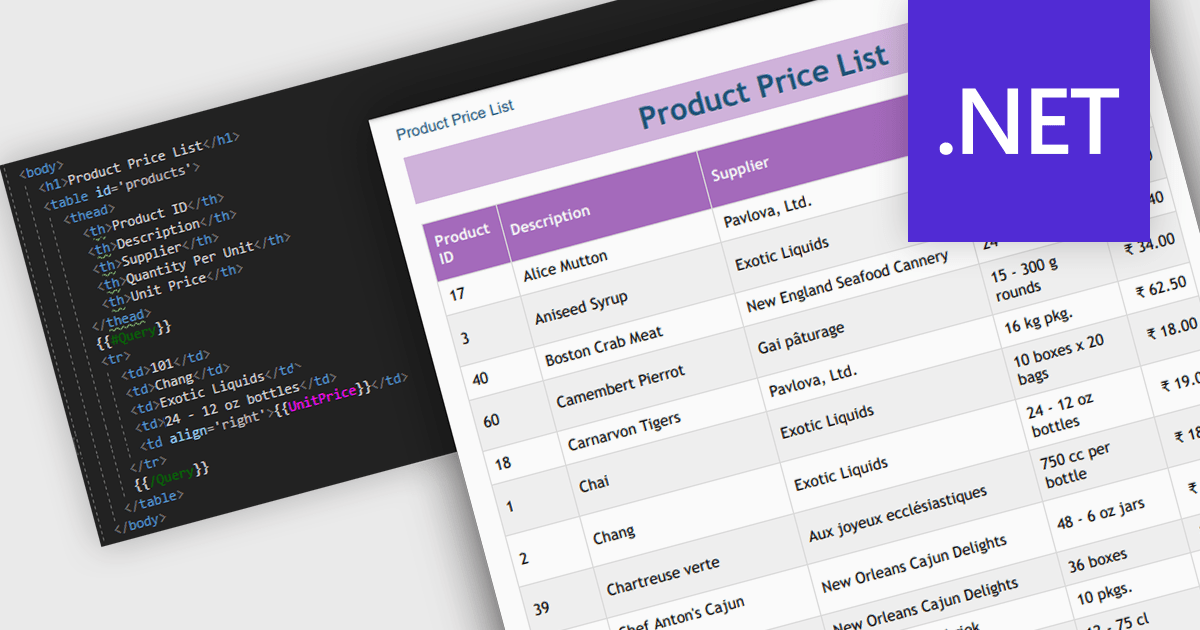
Convert HTML to PDF is a feature in a .NET PDF Viewer component that enables developers to generate PDF documents from HTML content, including text, images, styles, and web-based layouts, while preserving the original formatting. It is commonly used for creating reports, invoices, forms, and archived web content directly within .NET applications. The capability helps maintain consistent document presentation across platforms, supports automated document generation workflows, reduces the need for manual formatting, and allows existing HTML and CSS assets to be reused when producing professional-quality PDF output.
Several .NET PDF components offer convert HTML to PDF including:
For an in-depth analysis of features and price, visit our comparison of .NET PDF components.
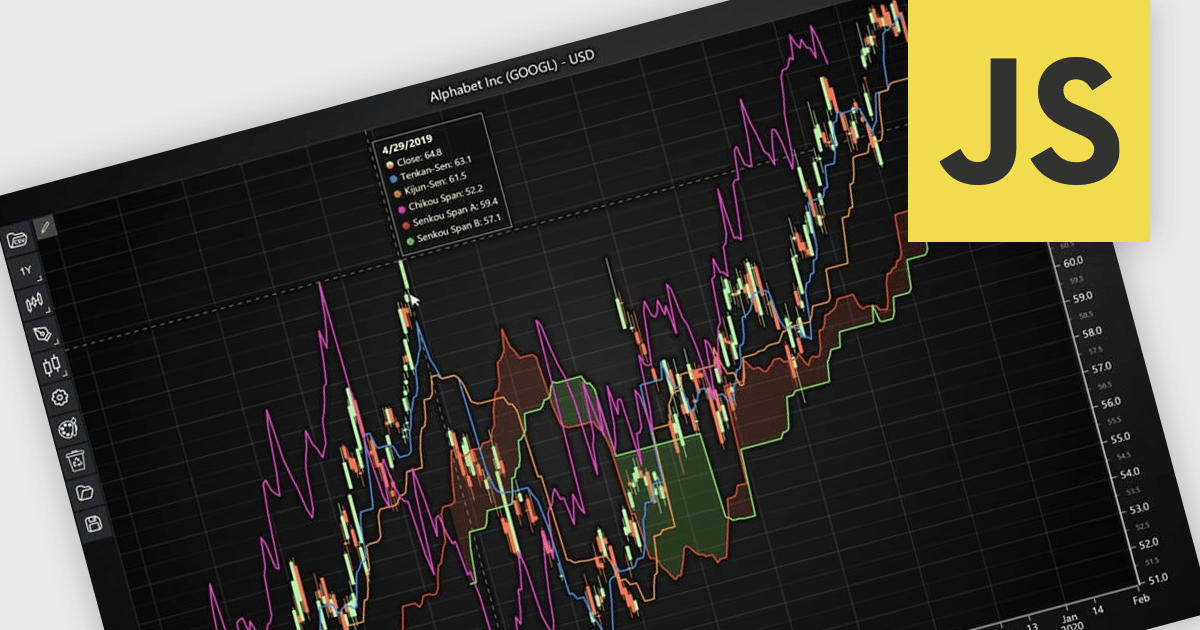
Chart indicators are tools that display calculated data on a chart to help users identify trends, measure momentum, recognize support and resistance levels, and spot potential reversals. By presenting complex market data as clear visual signals, they simplify analysis, support faster decision making, and help users uncover opportunities. Common use cases include tracking trend strength, confirming entry and exit points, and identifying key price levels where market direction may change.
Several JavaScript charting components provide support for indicators within financial charts, including:
For an in-depth analysis of features and price, visit our JavaScript chart components comparison.
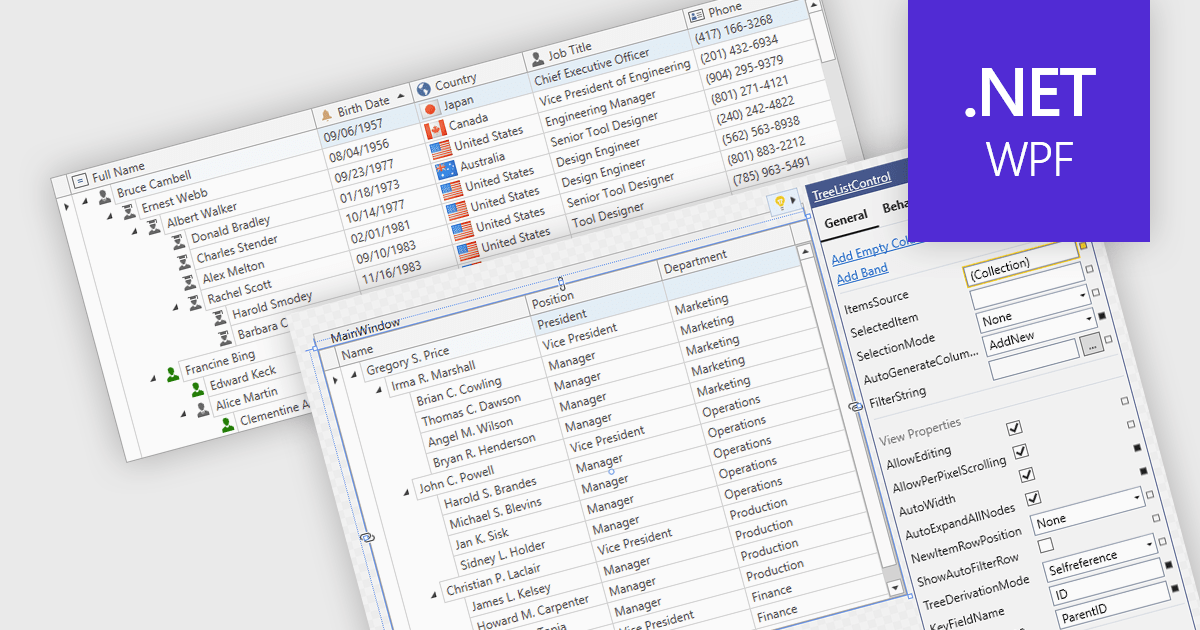
Treelist components present hierarchical data in a tabular format, combining the structure of a tree view with many of the capabilities commonly found in data grids. They allow users to expand and collapse parent-child relationships while viewing multiple data fields within the same interface. Treelists are commonly used to display organizational structures, project task hierarchies, file and folder systems, product categories, and other datasets that contain parent-child relationships. This approach helps organize complex datasets, improves navigation through large hierarchies, and can support tasks such as data viewing, editing, and management without requiring users to switch between different views.
Several WPF UI suites provide you with treelist functionality, including:
For an in-depth analysis of features and price, visit our comparison of WPF UI suites.
電話: (888) 850 9911
Fax: +1 770 250 6199


