


公式サプライヤー
公式および認定ディストリビューターとして200社以上の開発元から正規ライセンスを直接ご提供いたします。
当社のすべてのブランドをご覧ください。

Altova XMLSpy is a leading XML editor and integrated development environment (IDE) designed for creating and manipulating XML-based applications. It offers a comprehensive suite of tools for working with XML, JSON, XBRL, schemas, transformations, web services, and more. XMLSpy empowers developers to visually design schemas, edit and debug code, generate code from schemas, and leverage AI-assisted editing and debugging for enhanced productivity.
The XMLSpy 2026 update introduces a BSON editor that provides developers with the same level of intelligent editing and control they’re accustomed to when working with traditional JSON documents. BSON (Binary JSON) is a binary-encoded serialization format that extends JSON to support additional data types and faster encoding/decoding. This enhancement allows creation, validation, and transformation of BSON data within a familiar interface, supporting native BSON datatypes and enabling direct schema validation, conversion between formats, and data generation from JSON Schemas. By extending XMLSpy’s JSON editing capabilities to BSON, developers can efficiently manage MongoDB data structures with greater precision and productivity.
To see a full list of what's new in 2026, see our release notes.
Altova XMLSpy is licensed per Installed, Concurrent or Named user. Licenses are perpetual, and come with or without 1 year Support and Maintenance Package (SMP). See our Altova XMLSpy licensing page for full details.
Altova XMLSpy XML Editor is available to buy in the following products:
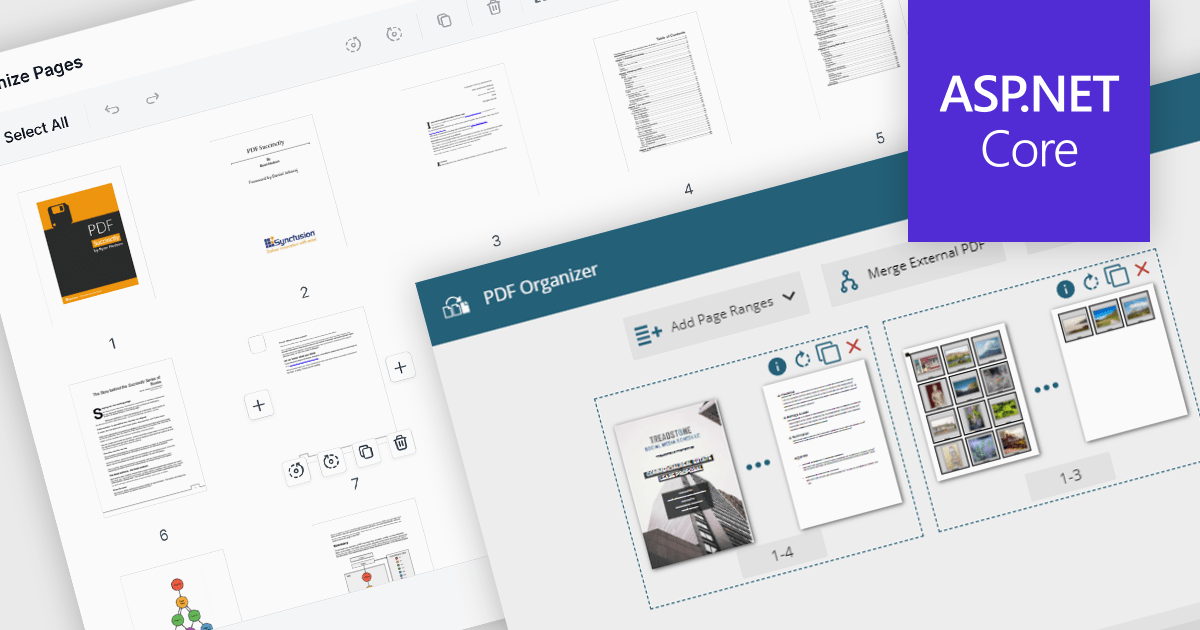
PDF manipulation features in viewer components extend the user experience beyond reading by enabling real-time structural changes to documents. These capabilities are particularly valuable in document-heavy workflows, where users need to rearrange, combine, or refine content without switching between multiple tools. Whether integrated into web portals, business systems, or productivity applications, built-in manipulation functions make PDF viewers more interactive and practical for day-to-day tasks such as document assembly, editing, and cleanup.
Common features include:
For an in-depth analysis of features and price, visit our ASP.NET Core PDF viewer components comparison.
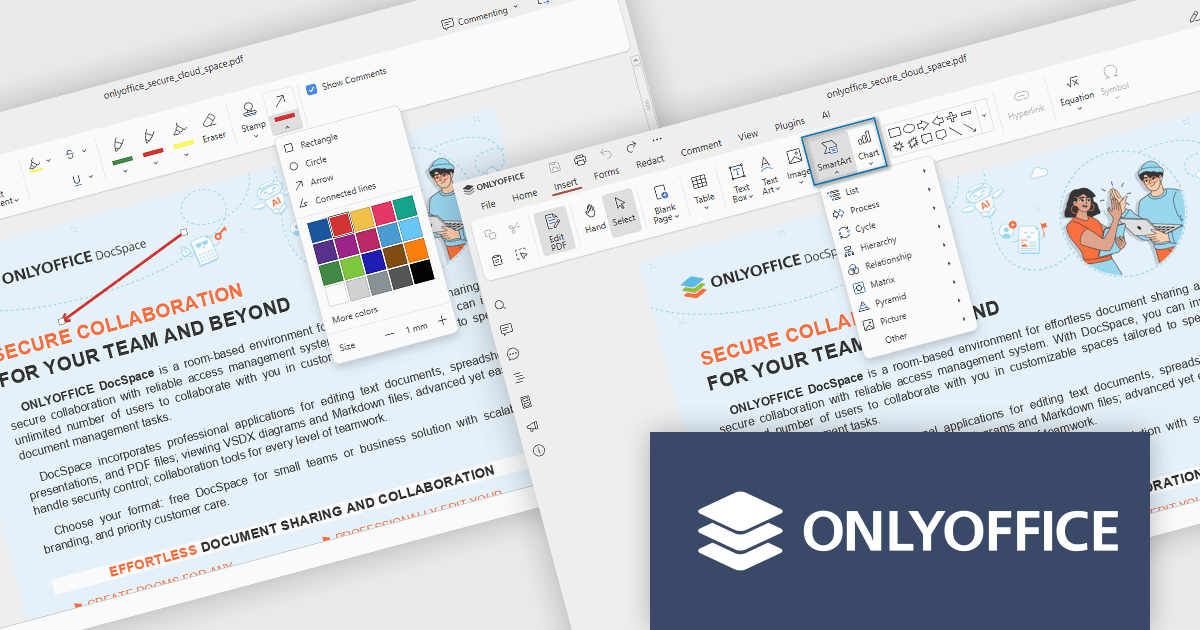
ONLYOFFICE Docs is a comprehensive online editor, allowing users to create text documents, spreadsheets, presentations, and forms. It enables your users to edit, share, and collaborate on documents online in their preferred browser, within your own application. It is fully compatible with OOXML (Office Open XML) formats and supports popular Microsoft Office and other document formats such as CSV, DOC, DOCX, EPUB, HTML, ODP, ODS, ODT, PDF, PPT, PPTX, RTF, TXT, XLS, and XLSX.
The ONLYOFFICE Docs v9.1 update enhances the PDF Editor to provide a more efficient and secure document management experience for developers and teams. It introduces advanced redaction tools that allow precise removal of sensitive information, including the ability to find and redact specific terms or entire pages. The update also expands annotation capabilities with customizable shapes and drawing tools for clearer document markup. Additionally, developers can now embed charts and SmartArt graphics directly within PDFs, enabling better visualization of data and smoother integration of visual elements without leaving the editing environment.
To see a full list of what's new in v9.1.0, see our release notes.
ONLYOFFICE Docs Developer Edition is licensed by the number of simultaneous document connections and is available as an annual license with 1 year support and upgrades. See our ONLYOFFICE Docs Developer Edition licensing page for full details.
For more information, see our ONLYOFFICE Docs Developer Edition product page.
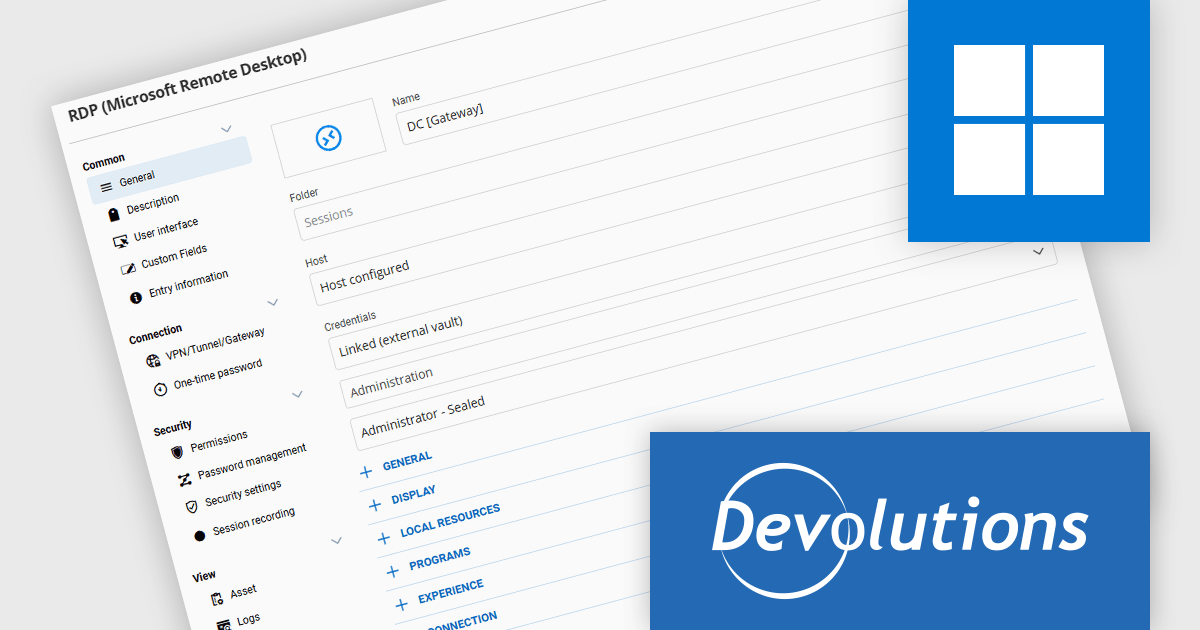
Devolutions Server is a secure, on-premises solution designed to centralize and manage privileged access, credentials, and remote connections for organizations. It enables IT professionals and software developers to securely store and share sensitive data like passwords, API keys, and remote session details within a centralized vault, with robust user access controls and role-based permissions. Devolutions Server integrates with existing infrastructure, supports multi-factor authentication, and provides auditing and logging capabilities to track activities and ensure compliance with security policies.
The Devolutions Server 2025.3 update introduces support for linking to an external vault, allowing developers to reference credentials stored in other vaults without duplication. This enhancement improves credential management by enabling a single source of truth for authentication data across multiple vaults. By linking credentials instead of copying them, teams can ensure consistent access, simplify password rotations, and maintain accurate audit trails. This approach reduces administrative overhead, minimizes configuration errors, and enhances security by preserving centralized control over sensitive information while still enabling flexible, cross-vault access.
To see a full list of what's new in version 2025.3.2.0, see our release notes.
Devolutions Server is available as part of the Devolutions Starter Pack, which is licensed per user and offered as an annual subscription. See our Devolutions Server licensing page for full details.
For more information, visit our Devolutions Server product page.
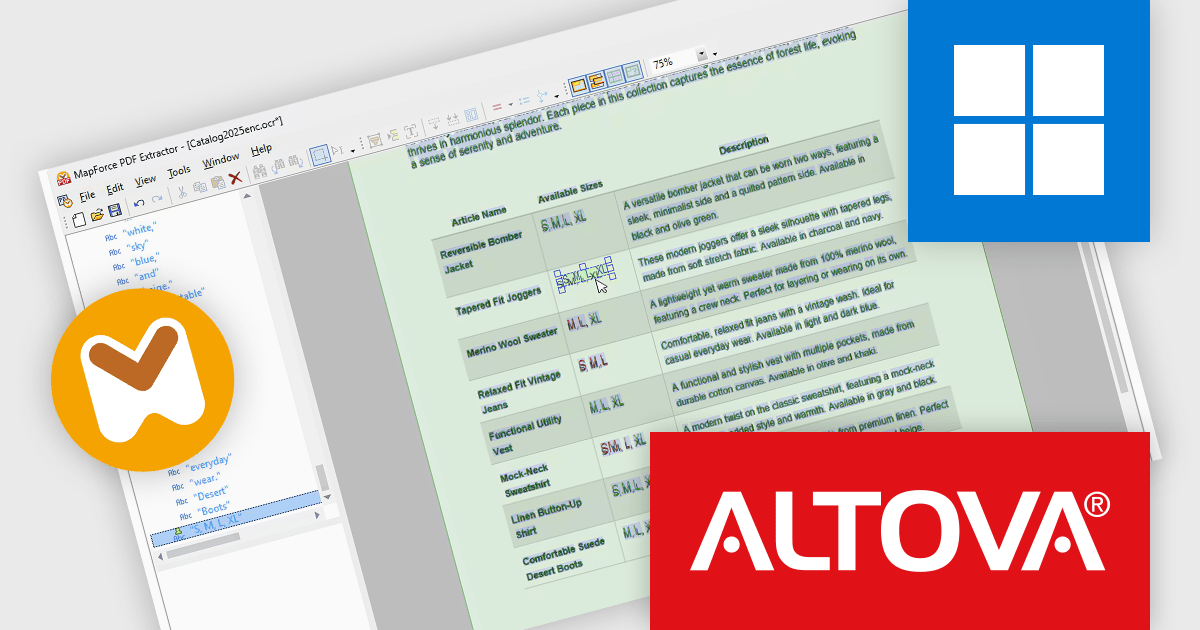
Altova MapForce is a graphical tool designed for seamless data integration and conversion. It empowers users to transform data between various formats, including XML, databases, flat files, PDFs, and web services, using a drag-and-drop interface. This eliminates the need for complex scripting and facilitates efficient data exchange across diverse applications, promoting streamlined workflows and enhanced data accuracy.
The Altova MapForce Enterprise 2026 update enhances PDF data integration by extending the PDF Extractor with full OCR processing, allowing developers to extract structured text and data from scanned or image-based PDF documents. This capability enables more comprehensive data mapping workflows by converting previously inaccessible content such as digitized paper records, forms, and legacy documents into searchable and editable text. Developers can visually inspect and refine OCR results within MapForce to ensure accuracy before integrating the extracted information into complex data transformations or automation pipelines.
To see a full list of what's new in version 2026, see our release notes.
Altova MapForce is licensed per Installed, Concurrent or Named user. Licenses are perpetual, and come with or without 1 year Support and Maintenance Package (SMP). See our Altova MapForce licensing page for full details.
Altova MapForce is available to buy in the following products:
電話: (888) 850 9911
Fax: +1 770 250 6199


