


公式サプライヤー
公式および認定ディストリビューターとして200社以上の開発元から正規ライセンスを直接ご提供いたします。
当社のすべてのブランドをご覧ください。
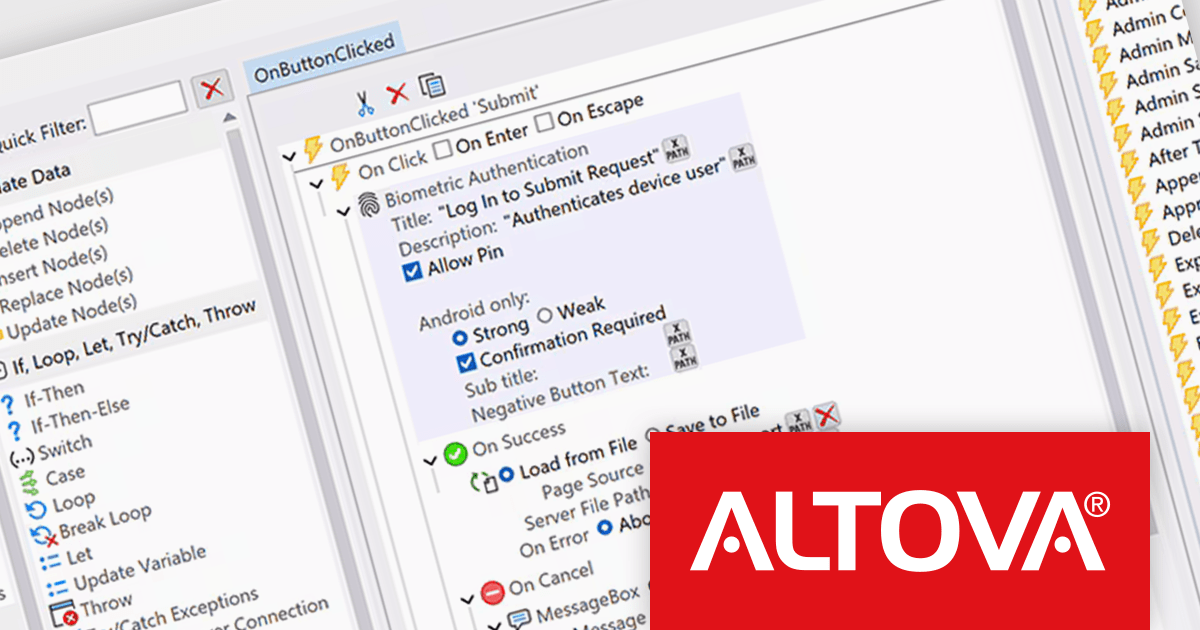
Altova MobileTogether is a rapid app development platform that empowers anyone, regardless of coding experience, to build sophisticated data-driven apps for all mobile and desktop platforms. With its visual UI design, drag-and-drop functionality, and powerful Action Tree programming language, MobileTogether improves the development process, enabling you to create custom database apps, integrate with backend systems, and deploy secure solutions swiftly and cost-effectively.
The MobileTogether 10.3 release introduces support for biometric authentication in client applications, allowing developers to incorporate face recognition or fingerprint scanning as a secure and convenient login method. An optional runtime function lets apps detect whether a user’s device supports biometric capabilities, enabling intelligent decisions about when to present authentication prompts. To ensure consistent access across devices and user preferences, a PIN-based fallback can also be configured, providing an alternative when biometric options are unavailable or not set up. Together, these enhancements offer a practical approach to improving both security and user experience in mobile solutions.
To see a full list of what's new in version 10.3, see our release notes.
MobileTogether is licensed per server core as an annual subscription. See our MobileTogether licensing page for full details.
For more information, visit our MobileTogether product page.
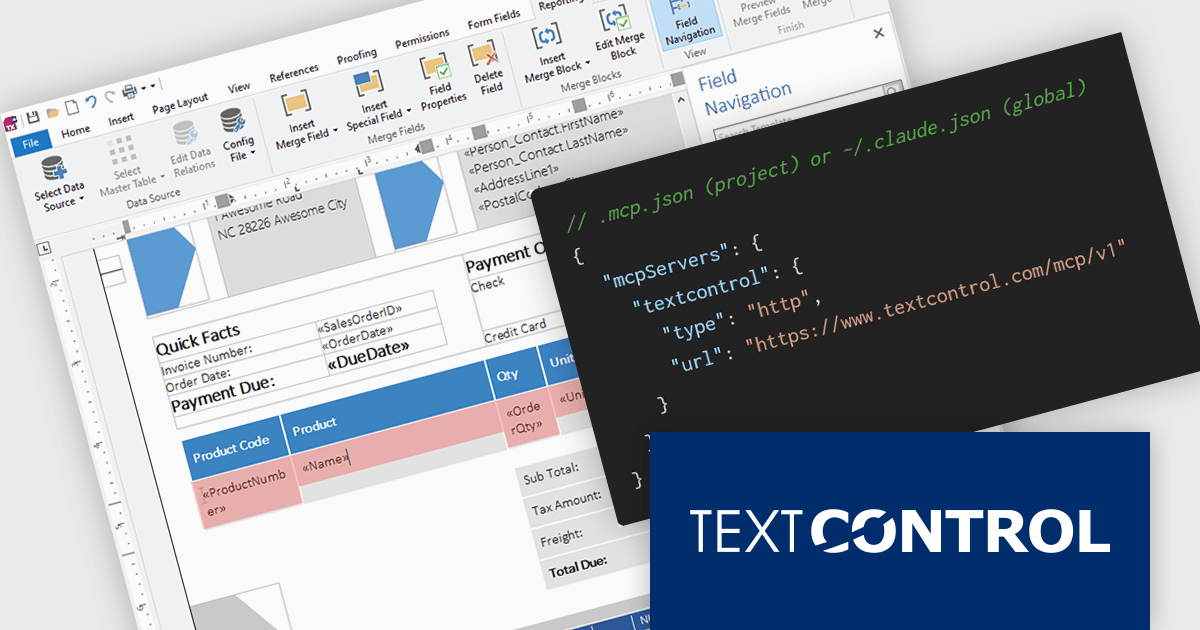
TX Text Control .NET is a royalty-free, fully programmable document editor that empowers developers to add rich WYSIWYG word processing to desktop and web applications across various platforms. It provides everything from comprehensive text formatting and mail merge to PDF creation and processing, all through a robust API and intuitive user interface.
The new Text Control MCP Server introduces a read-only Model Context Protocol (MCP) endpoint designed to integrate authoritative product knowledge into AI-assisted processes. By adding a single URL to an assistant’s configuration, developers can enable access to blog content, documentation, API references, and more, all without leaving the editor. This approach improves the relevance and accuracy of AI-generated responses, making it easier to work with up-to-date information across the entire Text Control ecosystem.
TX Text Control .NET for Windows Forms and TX Text Control .NET for WPF are licensed per developer and are available as a Perpetual License with a 12 month support and maintenance subscription. See our TX Text Control .NET for Windows Forms licensing page or TX Text Control .NET for WPF licensing page for full details.
TX Text Control .NET is available to buy in the following products:
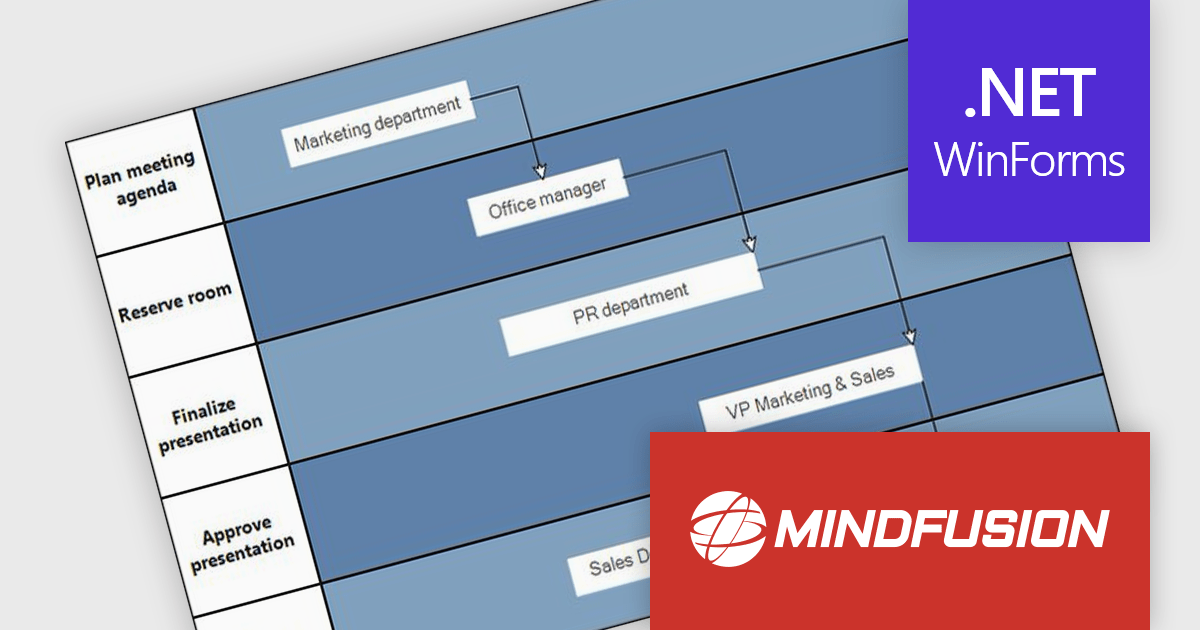
MindFusion.Diagramming for WinForms is a versatile diagramming component that enables developers to create and present workflows, process diagrams, database models, organizational charts, and more. It includes over 100 predefined node shapes, flexible table objects with unlimited rows and columns, and container nodes that can be nested to represent complex structures. With customizable links and arrowhead styles, it helps build clear and interactive visualizations, making it easier to organize information, communicate ideas, and support a wide range of business and technical applications.
The MindFusion.Diagramming for WinForms 7.2 update introduces the new Palette control, providing developers with a structured way to organize and present diagram elements within categorized, collapsible panels. This feature improves usability by enabling efficient navigation and selection of items, particularly in applications with large or complex sets of diagrams. With flexible APIs for adding categories and items programmatically or through collections, the Palette control improves development while supporting scalable user interfaces for diagram-driven applications.
To see a full list of what’s new in version 7.2, see our release notes.
MindFusion.Diagramming for WinForms is licensed per developer, per site, or across an entire enterprise with perpetual licensing. All options include royalty free distribution with no additional runtime or end user fees. See our MindFusion.Diagramming for WinForms licensing page for full details.
For more information, visit our MindFusion.Diagramming for WinForms product page.
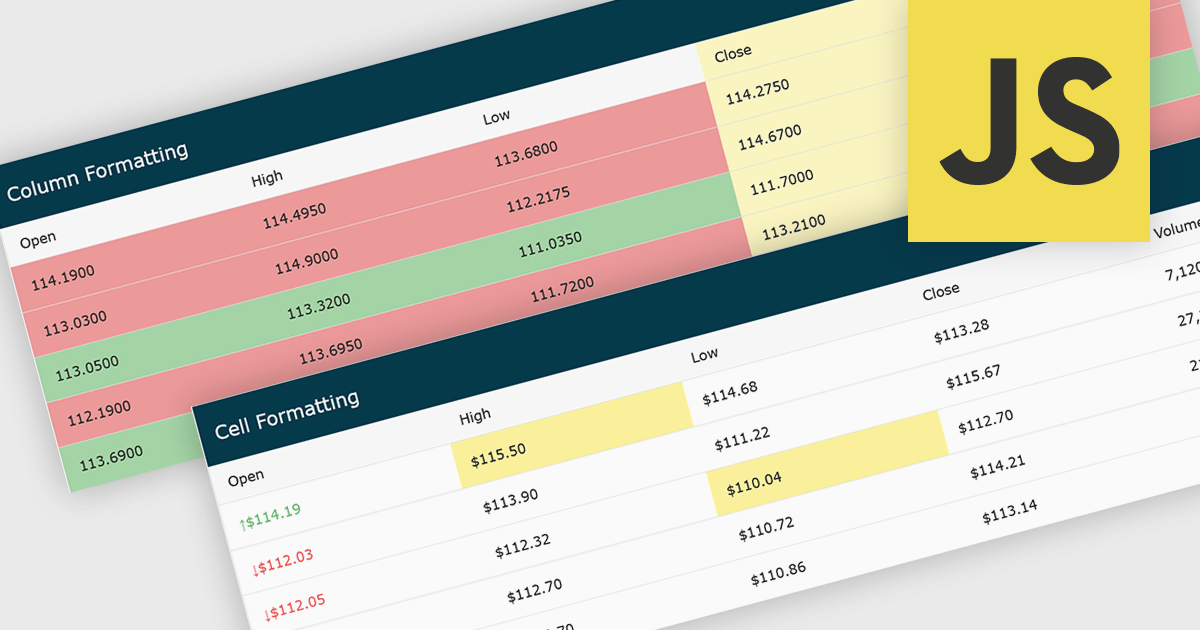
Conditional formatting in grids automatically applies visual styles such as colors or icons based on defined rules, making it easier to interpret large datasets at a glance. It improves readability, highlights patterns and outliers, and supports faster, more informed decision making by surfacing key insights in real time. Common use cases include flagging budget issues in financial reports, emphasizing top performing sales data, monitoring KPIs, and drawing attention to errors or critical statuses in operational tools.
Several JavaScript grid controls offer conditional formatting, including:
For an in-depth analysis of features and price, visit our comparison of JavaScript Grid controls.
FastReport .NET Ultimate is a comprehensive reporting solution for developers working within the Microsoft .NET ecosystem. It supports the creation, design, and delivery of rich, interactive reports across Windows Forms, ASP.NET, MVC, and .NET Core applications. The Ultimate edition includes server deployment capabilities and extensive export options, such as PDF, Excel, Word, and HTML. It connects to various data sources, including SQL databases and business objects, providing flexibility for enterprise-level reporting. With the integrated FastReport Online Designer, users can edit reports directly in their browsers, enabling efficient collaboration and modern, full-featured report design across both desktop and web platforms.
The latest FastReport .NET Ultimate update introduces support for Google Sheets as a data source, allowing reports to connect directly to cloud-based spreadsheets. It enables developers and data professionals to work with up-to-date information without manual data transfers, making it easier to incorporate shared or frequently updated datasets into reports. It simplifies access to external data while maintaining the familiar reporting experience, making it particularly useful for teams already relying on Google Sheets for data management.
FastReport .NET Ultimate is licensed per named user and is available as a perpetual license with a one-year subscription for updates and support. See our FastReport .NET Ultimate licensing page for full details.
For more information, visit our FastReport .NET Ultimate product page.
電話: (888) 850 9911
Fax: +1 770 250 6199


