


公式サプライヤー
公式および認定ディストリビューターとして200社以上の開発元から正規ライセンスを直接ご提供いたします。
当社のすべてのブランドをご覧ください。

Annotation support in a Vue.js chart component refers to the capability to overlay additional contextual elements, such as labels, markers, lines, or regions, directly onto a chart to highlight specific data points, thresholds, or events. This feature enables developers to enrich visualizations with meaningful insights without altering the underlying dataset, making it easier to communicate key information such as trends, anomalies, or business rules within the UI.
Several Vue.js chart components support chart annotations, including:
For an in-depth analysis of features and price, visit our comparison of Vue.js charting components.
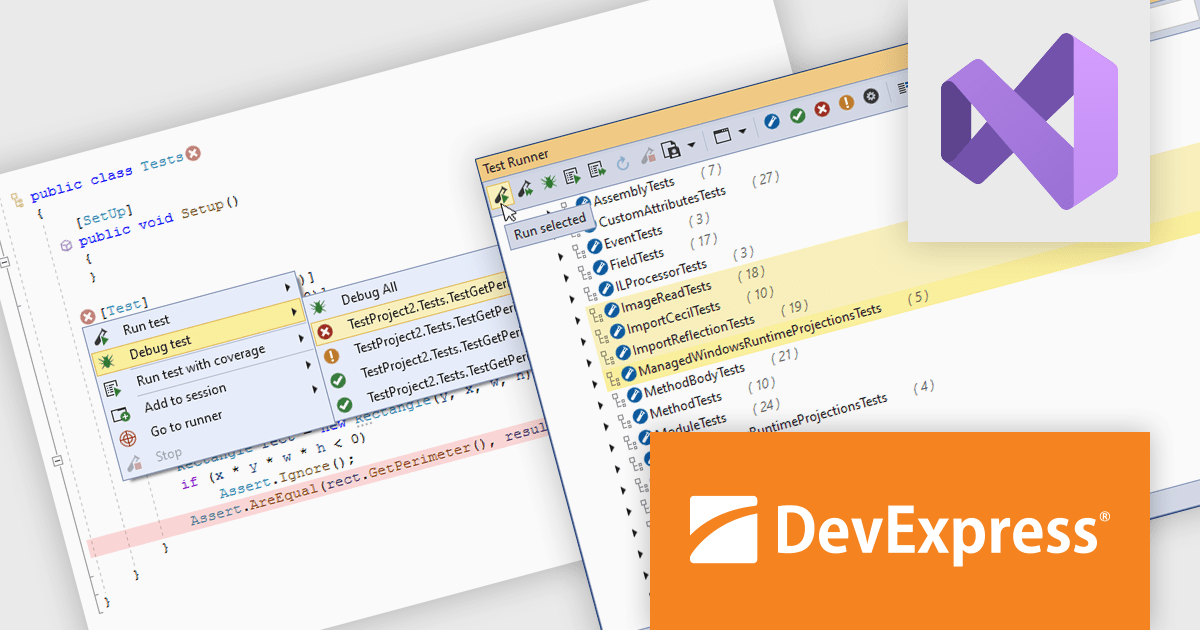
CodeRush Ultimate is a Visual Studio extension designed to improve developer productivity and creativity. It enables you to generate sophisticated code, automate tedious tasks, and navigate your codebase, all while boosting code quality and readability. By eliminating repetitive coding and providing intelligent assistance, CodeRush Ultimate frees you to focus on the big picture, helping you deliver more features faster and with higher quality.
CodeRush Ultimate improves developer productivity by enabling tests to be executed, debugged, and reviewed directly within the code editor. Its integrated Unit Test Runner supports multiple frameworks and provides clear visibility into test results, helping developers quickly identify issues, validate changes, and maintain code quality more efficiently throughout the development process.
CodeRush Ultimate is licensed per developer and is available as a Perpetual License with a 12 month support and maintenance subscription. See our CodeRush Ultimate licensing page for full details.
CodeRush Ultimate is available to buy in the following products:
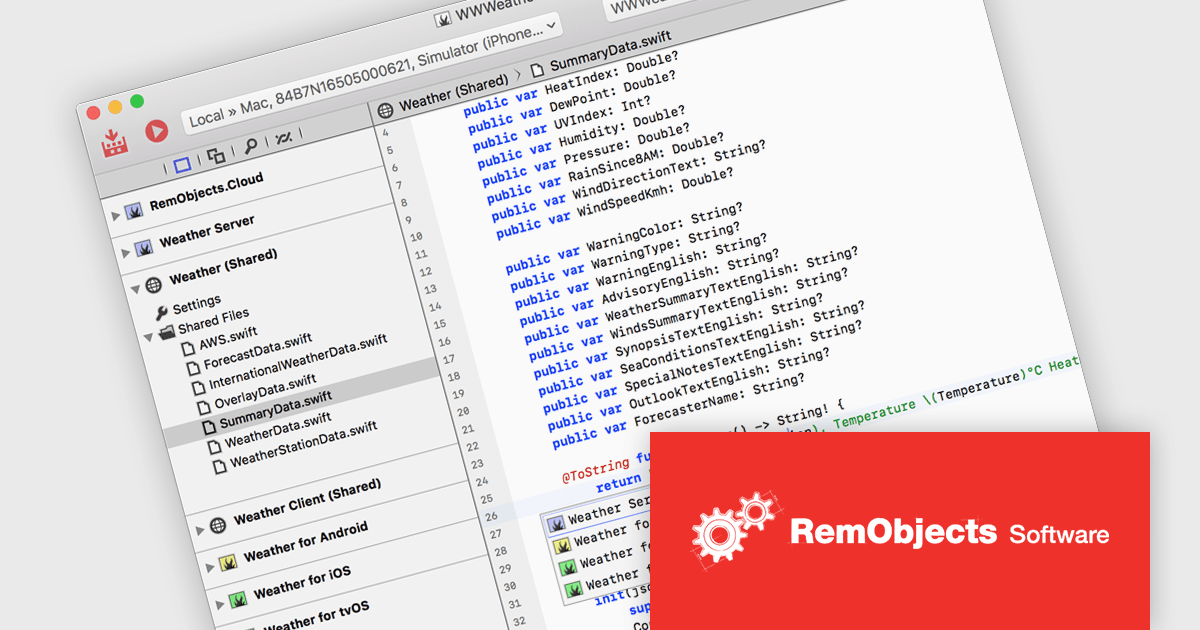
RemObjects Elements is a modern, multi purpose software development toolchain that enables developers to build applications for a wide range of platforms using six popular programming languages including Oxygene, Swift, C#, Java, Go and Mercury. It allows teams to target individual platforms or share code across multiple projects, reducing duplication and simplifying maintenance while maintaining flexibility in language choice. With integrated development environments for both Mac and Windows, it supports consistent workflows across operating systems, helping developers efficiently create native applications, manage cross platform solutions, and adapt to diverse project requirements.
RemObjects Elements enables developers to build cross platform applications using a single toolchain while sharing code across projects, reducing duplication and simplifying maintenance. By supporting multiple programming languages within the same environment, it allows teams to work with familiar syntax while targeting different platforms, improving efficiency and collaboration. Its unified workflow and integrated development environments for Mac and Windows help optimize and standardize development processes, making it easier to manage complex, multi platform solutions.
RemObjects Elements is licensed per user on an annual subscription basis, including free updates and standard support, with renewal required to continue use. Premium Support is an optional yearly upgrade, offering faster response times and support tickets that roll over while the subscription remains active. See our RemObjects Elements licensing page for full details.
Learn more on our RemObjects Elements product page.
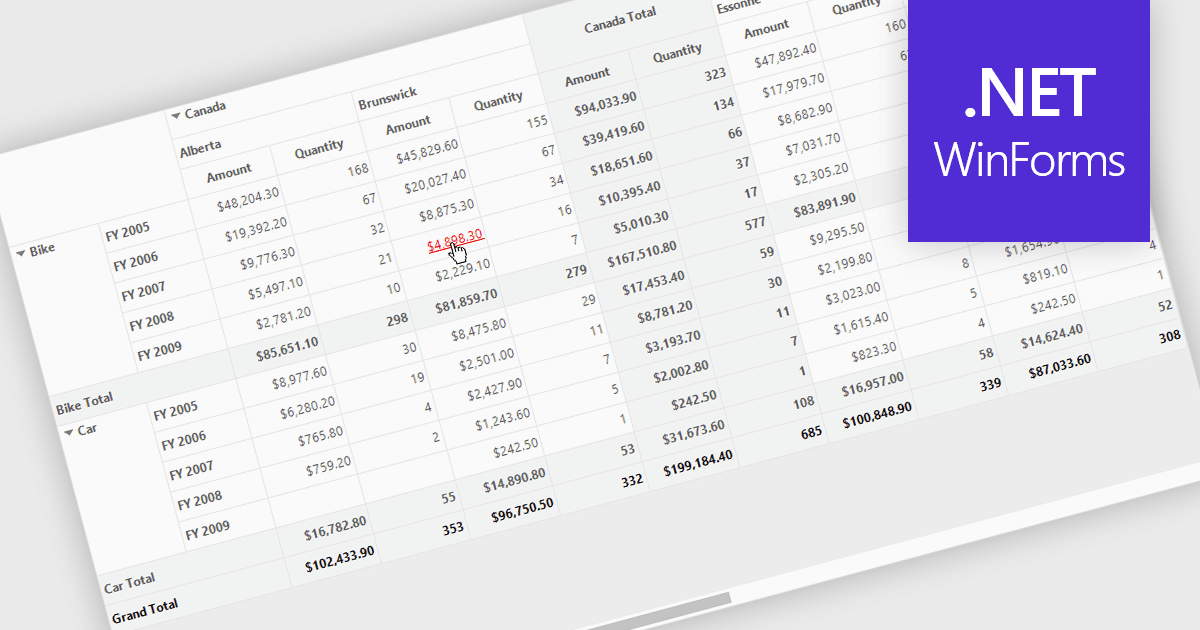
Hyperlinks in grids allow individual cells to function as clickable links, enabling users to navigate directly to related records, pages, or external resources. This makes data more interactive and improves usability by reducing manual searching. Users can quickly access additional context such as detailed views, reports, or linked systems without leaving the grid. Common use cases include linking customer names to profiles, order IDs to transaction details, or connecting data to external documentation, helping improve productivity and efficiency.
Several .NET WinForms grid controls offer hyperlink cell types, including:
For an in-depth analysis of features and price, visit our .NET WinForms grid controls comparison.
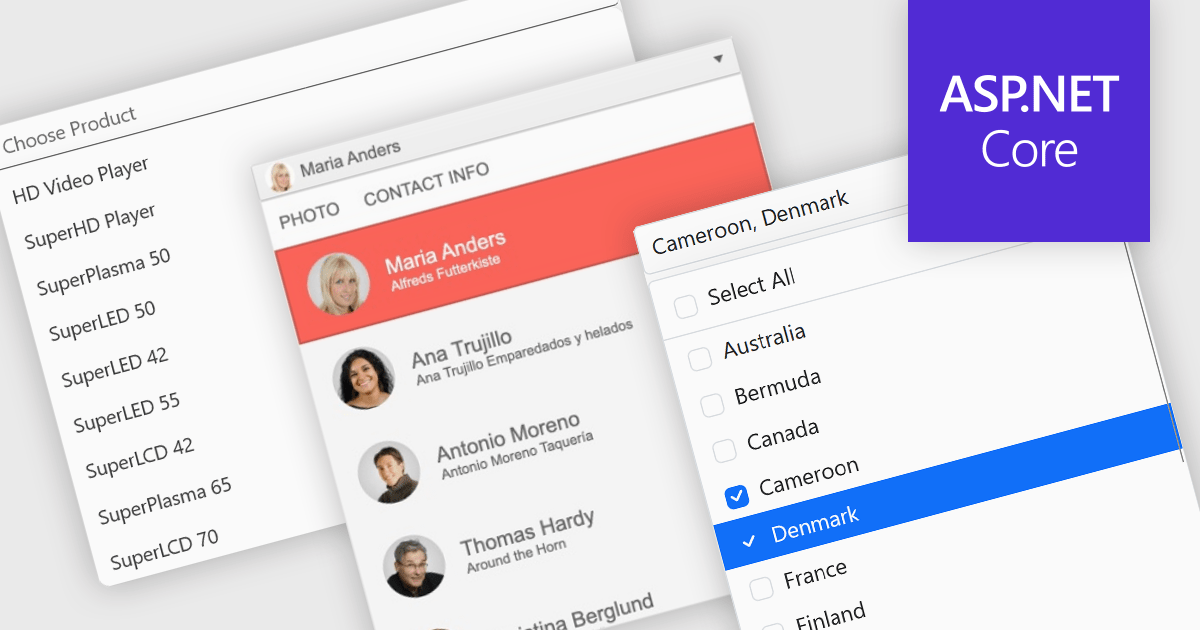
Dropdowns and lists provide structured ways for users to select and manage values within grids, forms, or tables. By constraining input to predefined options, these controls help maintain data consistency, reduce entry errors, and improve overall usability. They are commonly used in business applications where accuracy and efficiency are important, such as configuration panels, data management tools, and enterprise systems.
Common features include:
For an in-depth analysis of features and price, visit our ASP.NET Core data editor components comparison.
電話: (888) 850 9911
Fax: +1 770 250 6199


