


公式サプライヤー
公式および認定ディストリビューターとして200社以上の開発元から正規ライセンスを直接ご提供いたします。
当社のすべてのブランドをご覧ください。
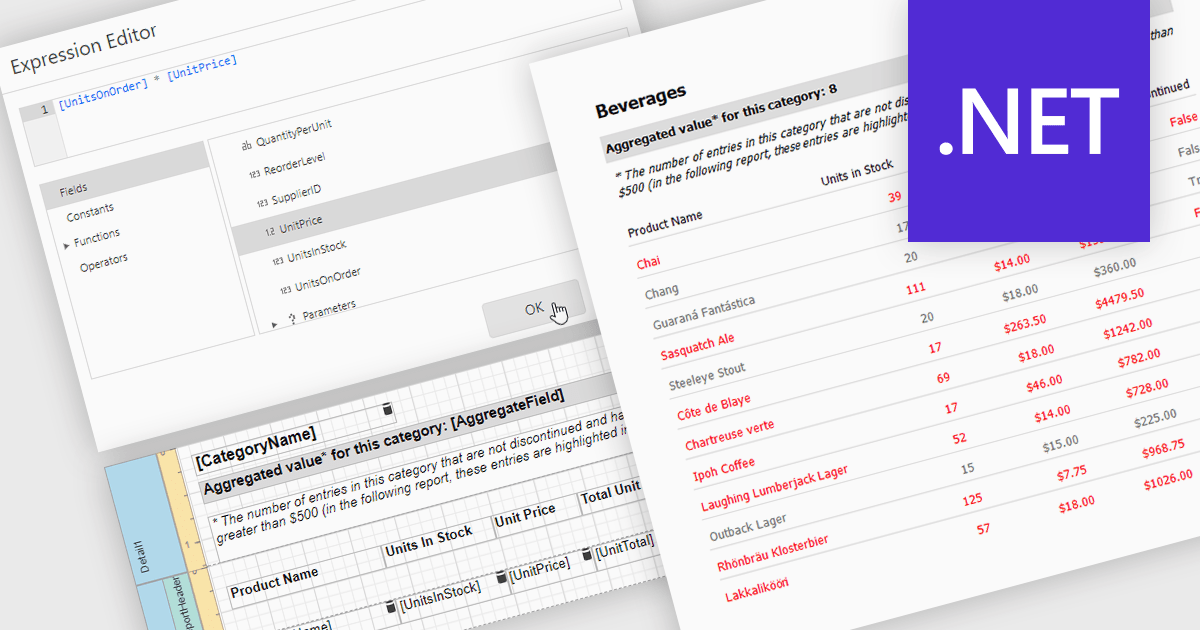
Calculated fields in reports allow you to apply custom expressions to one or more data fields, enabling data to be transformed directly within the reporting environment. This makes it possible to create new metrics such as percentages, ratios, or combined values without changing the underlying data source. As a result, reporting becomes more flexible and efficient, helping users uncover deeper insights and tailor outputs to specific needs. Calculated fields can also be used to group and sort data dynamically, improving how information is organized and presented. Common use cases include calculating profit margins, creating performance indicators, and combining fields to enhance report clarity.
Several .NET reporting controls offer calculated field functionality including:
For an in-depth analysis of features and price, visit our comparison of .NET Reporting controls.
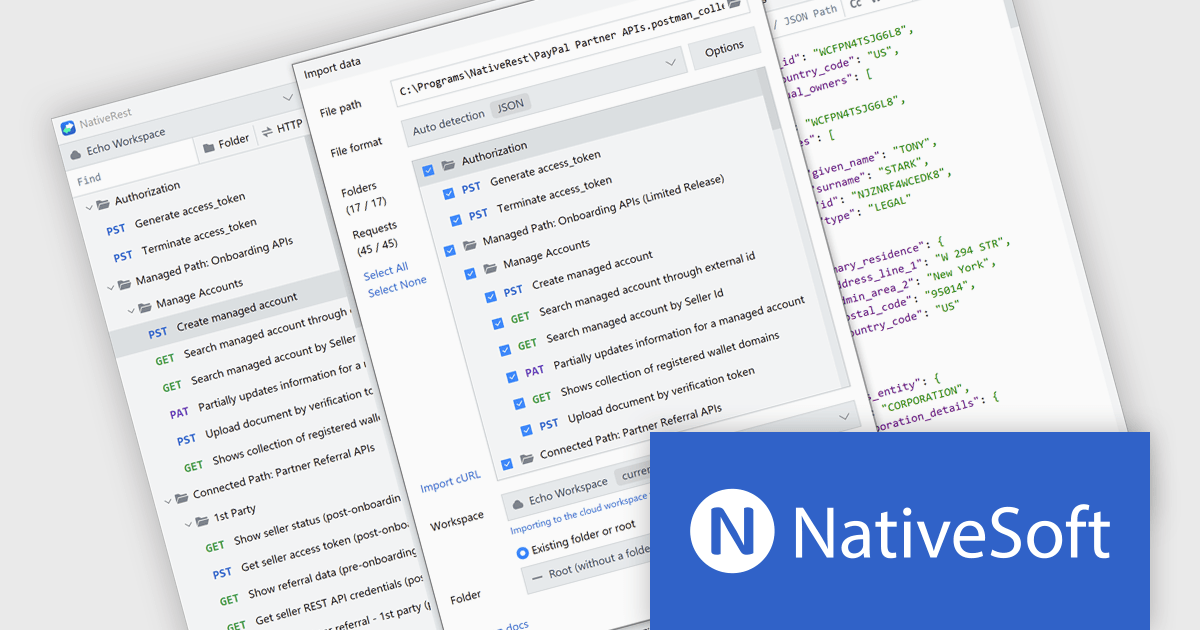
NativeRest is a high performance REST API client designed to improve API development, testing, and automation. It enables users to build complex HTTP requests, manage environments, and run automated tests using the built in Collection Runner. With support for authentication, code generation, and secure offline storage, it provides a flexible and reliable solution for handling critical API tasks. As a native application, NativeRest launches quickly and handles large datasets efficiently, making it a strong alternative to browser based tools. It is ideal for developers, testers, and teams working on enterprise APIs who need a stable and organized environment for building and maintaining integrations.
The NativeRest version 3.4.0 update introduces a fully rebuilt Postman import engine that focuses on accuracy and transparency when migrating complex workspaces. It now supports complete nested folder structures, ensuring that large-scale API projects retain their original organization. Expanded handling of request attributes and improved compatibility with testing scripts address common edge cases, reducing the need for manual adjustments after import. A new statistics dashboard provides immediate insight into the migration process, showing exactly how many requests, folders, and scripts were successfully transferred, helping teams validate their imports with confidence.
To see a full list of what's new in version 3.4.0, see our release notes.
NativeRest is licensed per developer with perpetual lifetime licenses, offering flexible Cloud and Team options that include advanced features, collaboration, and priority support. See our NativeRest licensing page for full details.
Learn more on our NativeRest product page.

ComponentSource is proud to celebrate a 5-year partnership with VisualSP, a leader in contextual learning and in-app support solutions. VisualSP provides a Visual Support Platform designed to help organizations navigate constant change by delivering bite-sized, contextual microlearning directly within enterprise web applications. Their solutions are built to reduce the impact of the forgetting curve, enabling employees to quickly access relevant guidance exactly when they need it, without disrupting their work.
VisualSP offers a range of customizable training and support tools that overlay onto existing enterprise systems, delivering targeted, role-based assistance through a cloud-based platform hosted on Microsoft Azure. Their flagship product, VisualSP Enterprise, exemplifies this approach by providing a fully integrated, plug-and-play solution that empowers users with real-time, in-context help tailored to their environment and permissions.
This collaboration enables ComponentSource to further differentiate its product offering by providing customers with innovative, user-centric training solutions that enhance productivity and user adoption. By distributing VisualSP’s solutions globally, ComponentSource helps organizations worldwide implement smarter support systems, ensuring employees can maximize the value of their enterprise applications with ease and efficiency.
Learn more about VisualSP.
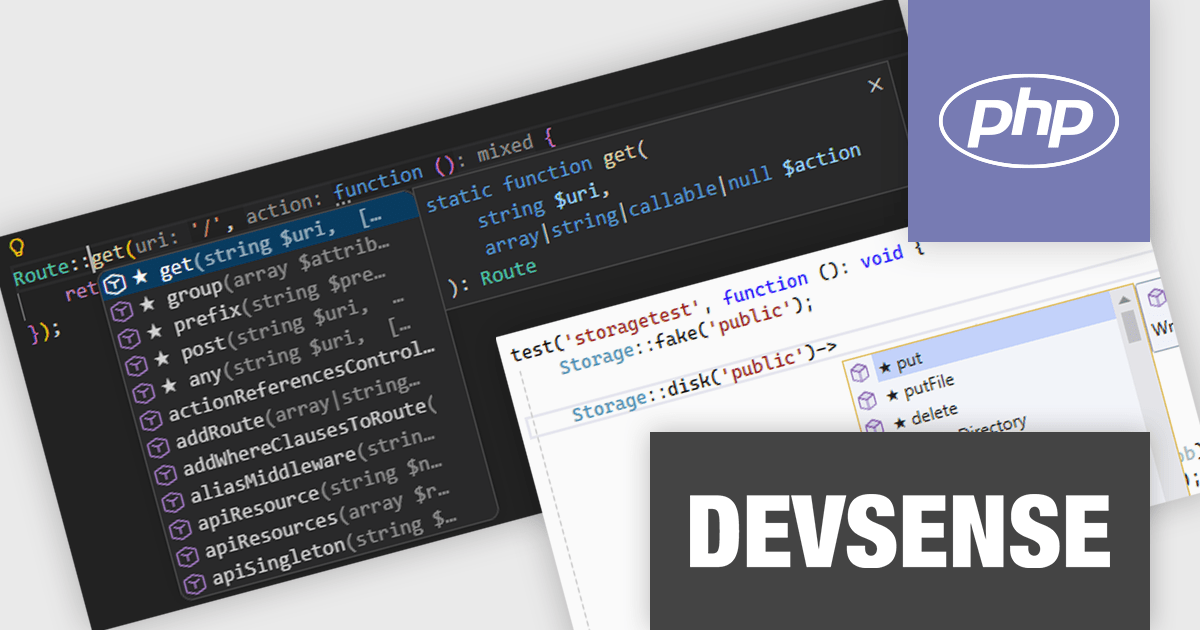
PHP Tools for Visual Studio converts Microsoft's IDE into a complete PHP development environment, increasing productivity with features such as smart code analysis, preemptive code completion, integrated debugging, and project management. This single package combines Visual Studio's familiar interface with industry-standard capabilities, allowing you to easily develop PHP applications and websites.
The PHP Tools for Visual Studio v1.89 update introduces starred suggestions within the code completion system, visually marking the most relevant options with a star icon and automatically placing them at the top of the list. By prioritizing these starred suggestions, it reduces the need to scan through extensive completion lists and helps developers select the correct option more efficiently. The feature is particularly useful in complex projects where large numbers of symbols, methods, and variables can otherwise slow down development.
To see a full list of what's new in v1.89.18735, see our release notes.
PHP Tools for Visual Studio is licensed per developer and is available as a perpetual license with 1 year of upgrades and support. See our PHP Tools for Visual Studio licensing page for full details.
For more information, see our PHP Tools for Visual Studio product page.
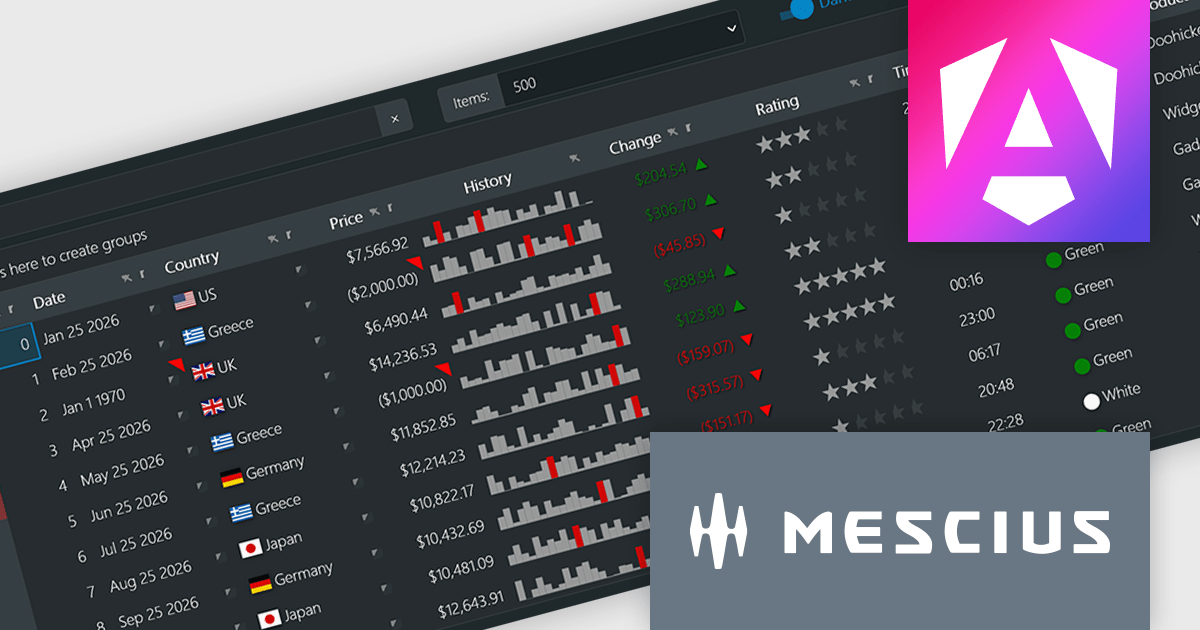
Wijmo by MESCIUS is a comprehensive JavaScript library offering a suite of high-performance UI components and data grids specifically designed to streamline the development of modern enterprise applications. It emphasizes reduced development time and improved maintainability, along with a focus on performance through its efficient design and small module size. Wijmo integrates seamlessly with popular JavaScript frameworks like Angular, React, and Vue.js, and supports cutting-edge technologies like TypeScript, making it a versatile solution for building complex web applications.
The Wijmo 2026 v1 update introduces support for Angular 21, enabling developers to adopt the latest framework capabilities while maintaining full compatibility with Wijmo’s comprehensive component library. This support ensures smoother integration, improved application performance, and alignment with current Angular development standards. Developers can build more responsive and maintainable applications while benefiting from advanced features such as FlexGrid cell templates and a high performance Angular DataGrid, helping deliver modern user experiences more efficiently.
To see a full list of what's new in 2026 v1, see our release notes.
Wijmo is licensed per developer. Developer Licenses are perpetual and include 1 year Subscription which provides upgrades, including bug fixes and new features. See our Wijmo licensing page for full details.
Learn more on our Wijmo product page.
電話: (888) 850 9911
Fax: +1 770 250 6199


