


公式サプライヤー
公式および認定ディストリビューターとして200社以上の開発元から正規ライセンスを直接ご提供いたします。
当社のすべてのブランドをご覧ください。
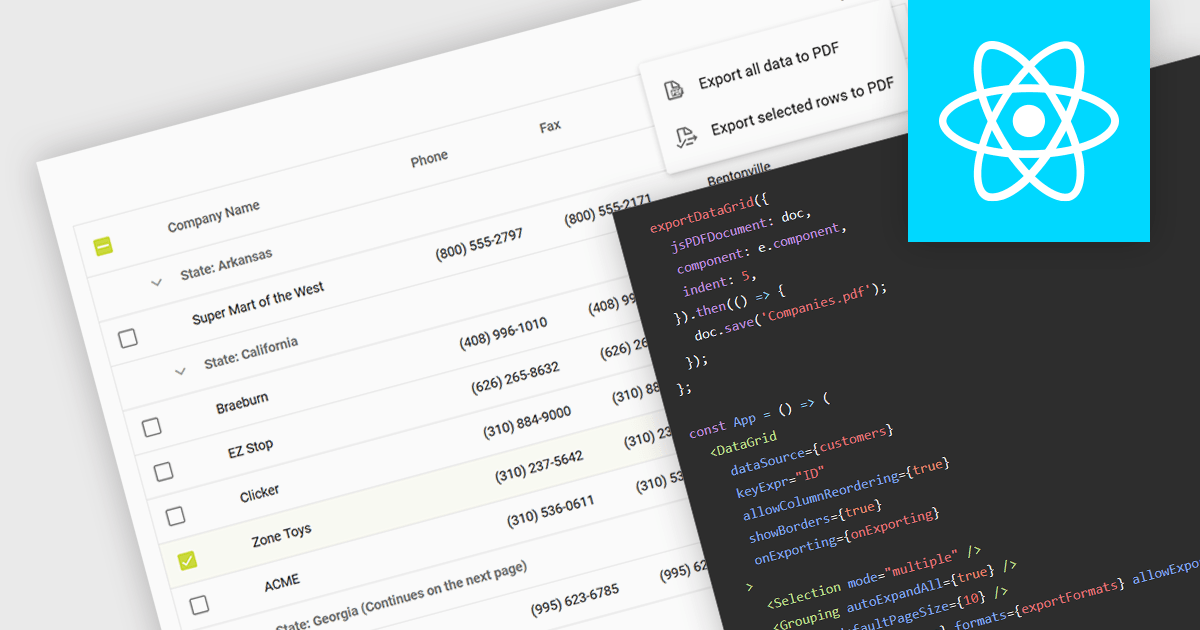
Exporting a data grid to PDF captures the grid layout, including columns, rows, and formatting, and transforms it into a universally accessible and easily shareable document. The export creates a static file, retaining the original grid layout and formatting, that can be easily distributed and viewed consistently across different platforms and on any device with a PDF reader. Additionally, PDFs provide a secure format for preserving data integrity and can be protected against unauthorized editing, making them ideal for official documentation and archiving purposes. This functionality enhances collaboration and data dissemination efficiency by simplifying the sharing and printing processes while maintaining the original data structure and presentation.
Several React grid components allow you to export to PDF, including:
For an in-depth analysis of features and price, visit our comparison of React grid components.
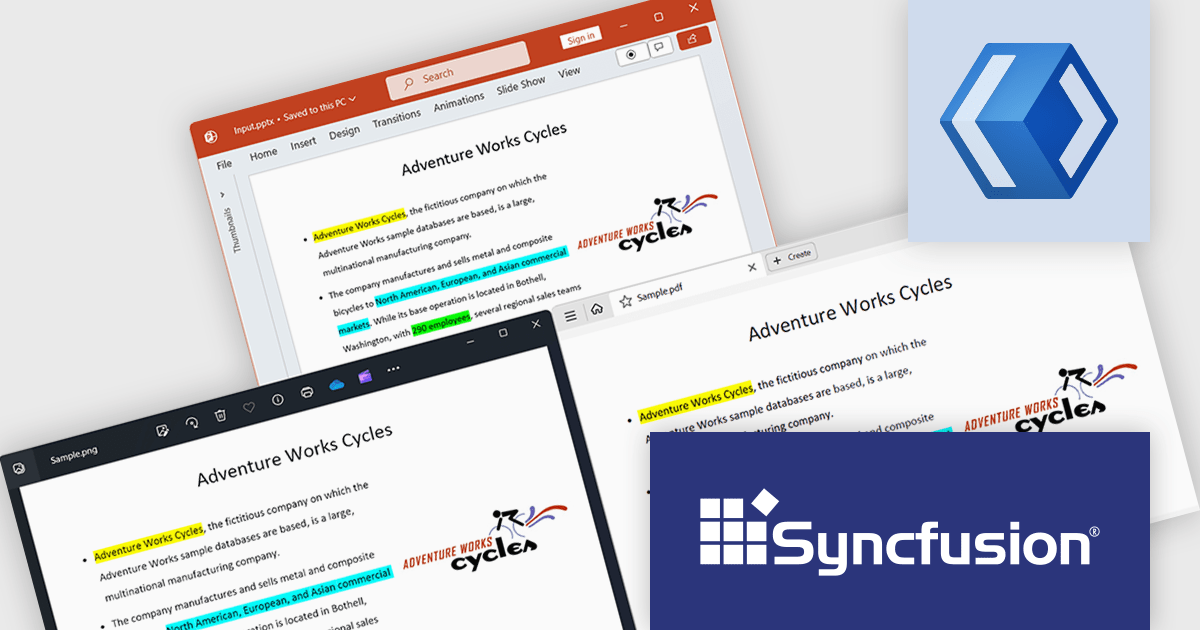
Syncfusion Essential Studio WinUI, available as part of Syncfusion Essential Studio Enterprise, is a comprehensive toolkit for building high performance native Windows desktop applications. It offers tools for crafting modern UI elements like charts, data grids, and ribbon interfaces, alongside powerful editing tools for Word, Excel, and PDF documents.
The Syncfusion Essential Studio WinUI 2024 Volume 2 (26.1.35) release adds support for preserving highlights when converting a PowerPoint presentation to a PDF or image. Highlights within the original presentation will be maintained with their exact colors during the conversion process, ensuring a precise representation in the resulting PDF or image file.
To see a full list of what's new in 2024 Volume 2 (26.1.35), see our release notes.
Syncfusion Essential Studio WinUI is available as part of Syncfusion Essential Studio Enterprise which is licensed per developer starting with a Team License of up to five developers. It is available as a 12 Month Timed Subscription License which includes support and maintenance. See our Syncfusion Essential Studio Enterprise licensing page for full details.
Learn more on our Syncfusion Essential Studio WinUI product page.
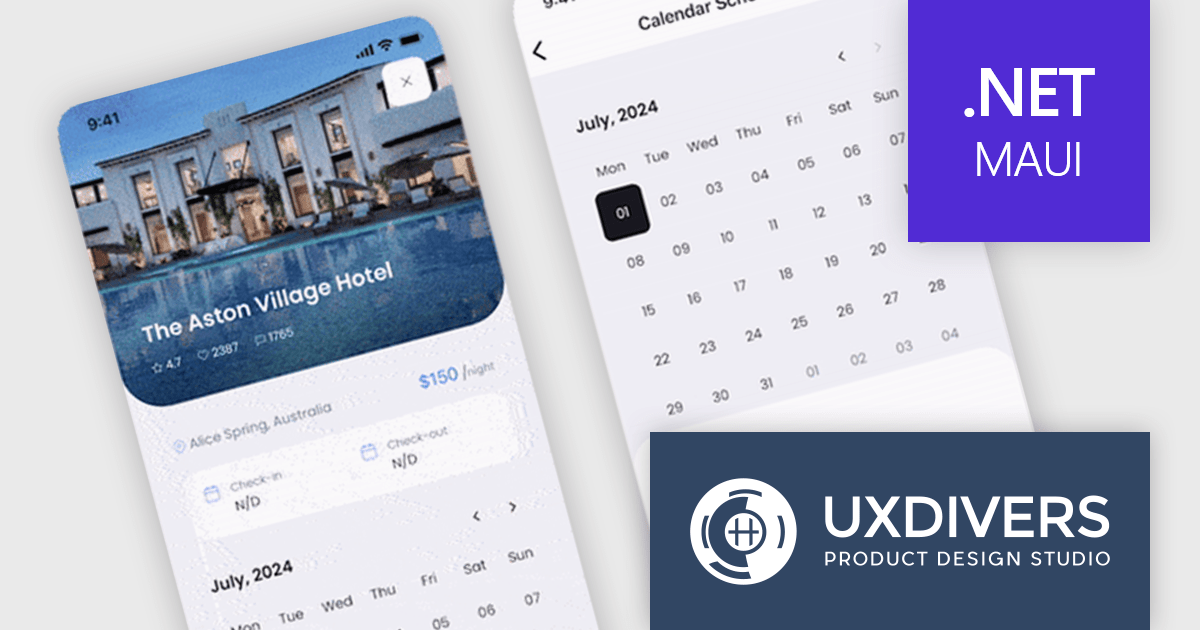
Grial UI Kit by UXDivers is a collection of pre-designed user interface components and templates specifically built for Xamarin.Forms and .NET MAUI app development. It offers a wide range of customizable XAML code snippets, custom controls, and helpers, allowing developers to rapidly build modern and visually appealing mobile applications for Android and iOS platforms while focusing on the core functionalities of the app.
The Grial UI Kit 2024.3 release introduces a highly requested feature: the Grial Calendar control. Designed to streamline the process of selecting dates and date ranges, this intuitive calendar is perfect for a variety of use cases. Whether you are scheduling appointments, booking events, or simply allowing users to pick dates in your .NET MAUI applications, the Grial Calendar provides a beautiful and user-friendly experience. The control is also fully customizable, giving you the freedom to style and configure it to perfectly match the look and feel of your app.
To see a full list of what's new in 2024.3, see our release notes.
Grial UI Kit is licensed per application and is available as an perpetual license. See our Grial UI Kit licensing page for full details.
For more information, see our Grial UI Kit product page.
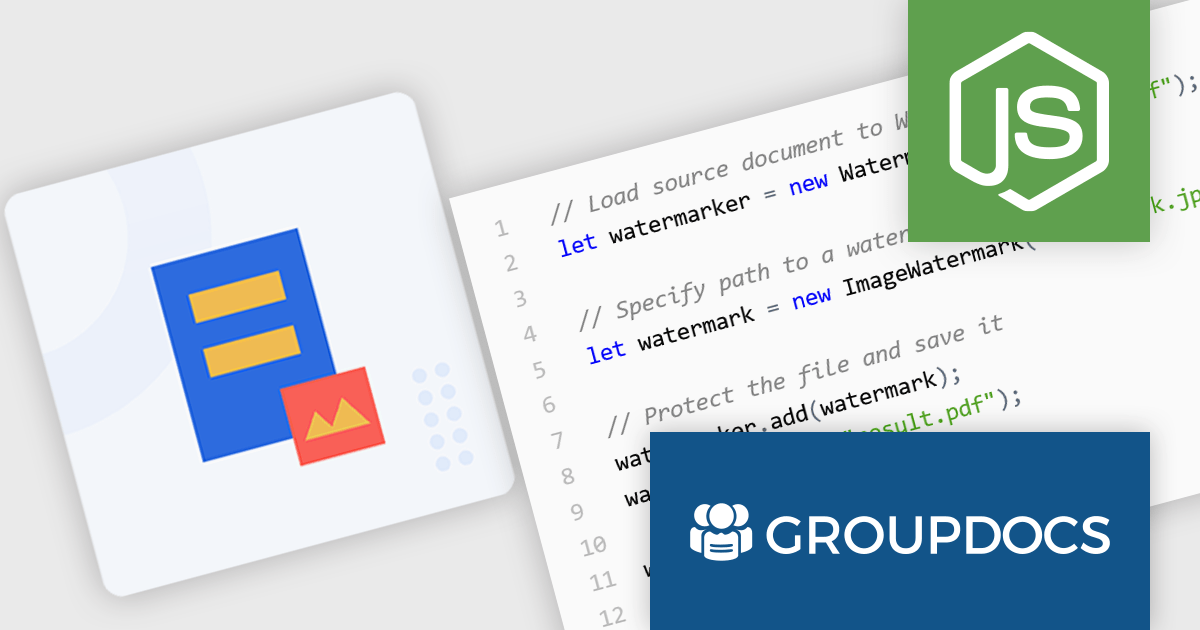
GroupDocs.Watermark for Node.js via Java empowers developers with a powerful document watermarking solution designed to seamlessly integrate into Node.js applications. This library, leveraging the capabilities of the Java API, extends Node.js functionality to add, search for, and remove watermarks from various document formats. Supported formats include popular choices like PDF, Microsoft Office suite files (Word, Excel, PowerPoint), and common image formats (JPEG, PNG, etc.).
This robust solution offers a multitude of benefits for developers. It bolsters document security by embedding watermarks, such as text or images, to deter unauthorized copying. Customization options allow for fine-tuning watermark appearance, including font styles, opacity, and positioning within the document. GroupDocs.Watermark for Node.js via Java caters to various use cases, including protecting sensitive documents, branding presentations, and adding copyright information to images.
GroupDocs.Watermark for Node.js via Java is offered as Developer Small Business, Developer OEM, Site Small Business, and Site OEM licenses catering to a range of business needs. Licenses are perpetual, and include 1 year of support and maintenance. Subscription renewals are also available. See our GroupDocs.Watermark for Node.js via Java licensing page for full details.
GroupDocs.Watermark for Node.js via Java is available in the following products:

JetBrains Academy is an online educational platform designed to help developers advance their programming skills. It provides a holistic approach to learning in which users study the theory and immediately put it into practice by building working applications. The project-based learning environment is integrated with JetBrains IDEs, and allows developers to learn Java, Python, and other programming languages with ease.
The JetBrains Academy July 2024 update expands its JavaScript curriculum with a brand new section dedicated to introducing testing frameworks. This course emphasizes the importance of testing in JavaScript development to ensure reliable code. It introduces key testing concepts including terminology and different testing types, and explores popular JavaScript testing frameworks, equipping you with the foundational knowledge to confidently write tests and improve your development workflow.
To see a full list of what's new, see our release notes.
JetBrains Academy is licensed per user as a commercial annual subscription. See our JetBrains Academy for Organizations licensing page for full details.
For more information, visit our JetBrains Academy for Organizations product page.
電話: (888) 850 9911
Fax: +1 770 250 6199


