


公式サプライヤー
公式および認定ディストリビューターとして200社以上の開発元から正規ライセンスを直接ご提供いたします。
当社のすべてのブランドをご覧ください。
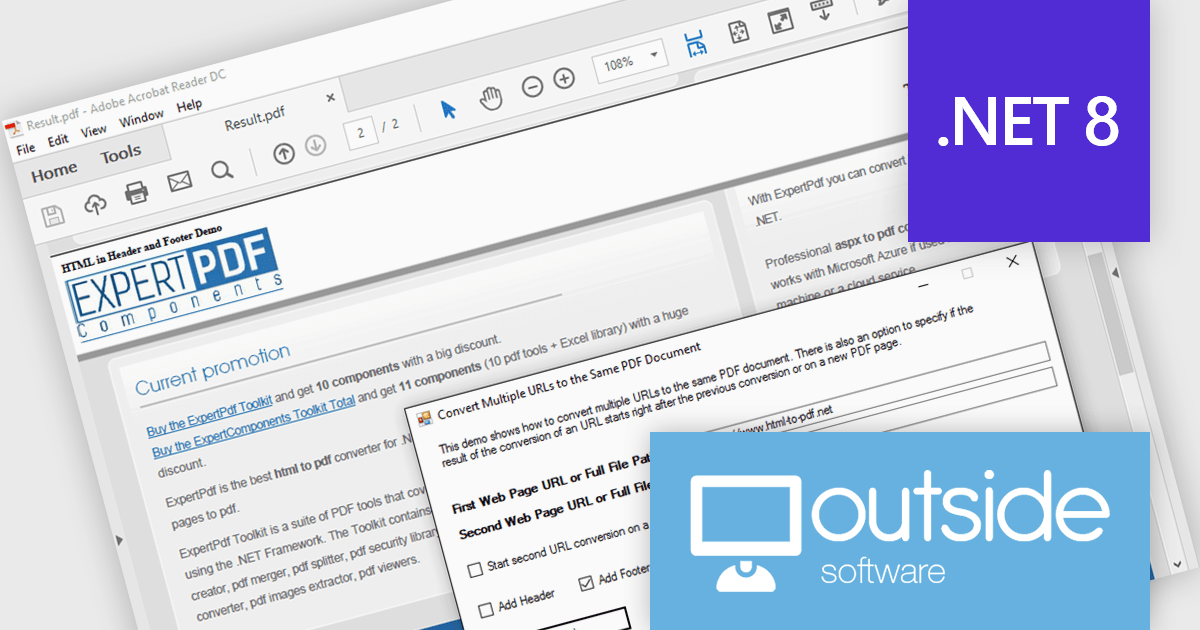
ExpertPDF HtmlToPdf Converter is a .NET library developed by Outside Software that enables programmers to integrate HTML to PDF conversion functionality within their .NET applications. The library boasts compatibility with modern web standards like HTML5, CSS3, and JavaScript, streamlining the process of generating PDF reports directly from ASP.NET pages.
The ExpertPDF HtmlToPdf Converter 19.0 update expands its reach by offering compatibility with .NET 8. This addition allows developers to leverage the latest features of .NET within their applications while utilizing the robust HTML to PDF conversion capabilities of ExpertPDF. This ensures seamless integration and continued support for modern development environments.
ExpertPDF HtmlToPdf Converter is licensed per developer, single application deployment, and is available as a Perpetual license with or without 1 year support and maintenance. See our ExpertPDF HtmlToPdf Converter licensing page for full details.
ExpertPDF HtmlToPdf Converter is available to buy in the following products:
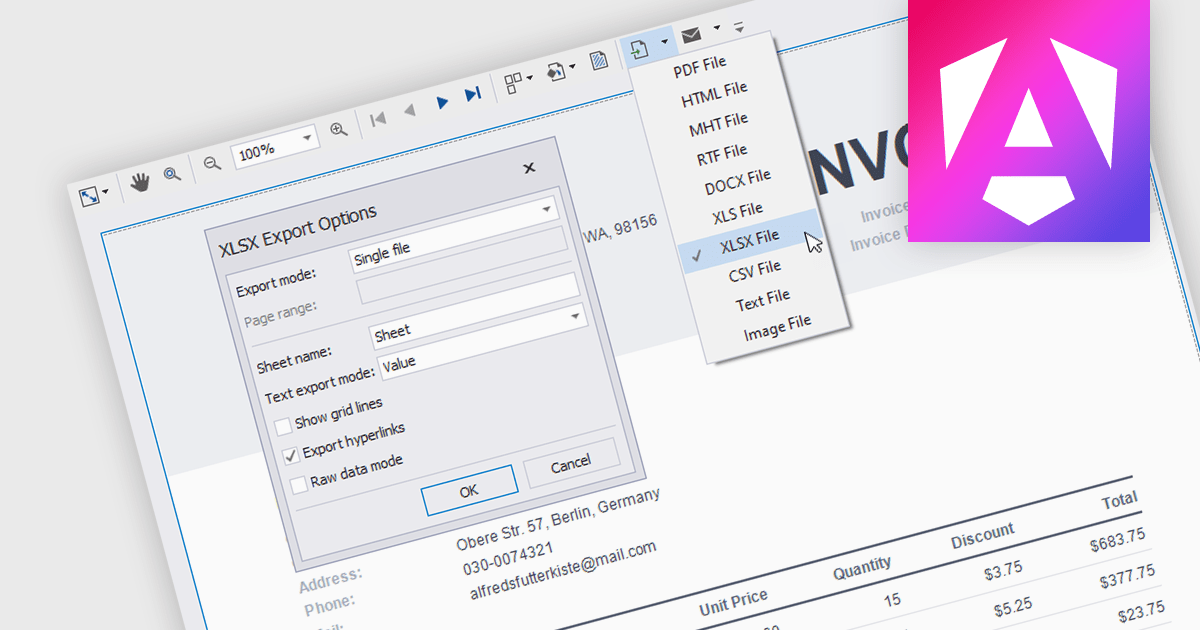
Reporting components with built-in XLS and XLSX export allow users to seamlessly generate Excel files directly from Angular web applications. This functionality empowers users to easily share and analyze report data in their preferred spreadsheet software, enhancing data accessibility and promoting informed decision-making. These components are particularly valuable for generating financial reports, sales data summaries, and other analytical exports.
Several Angular reporting components allow you to export reports to XLS or XLSX format:
For an in-depth analysis of features and price, visit our comparison of Angular reporting components.
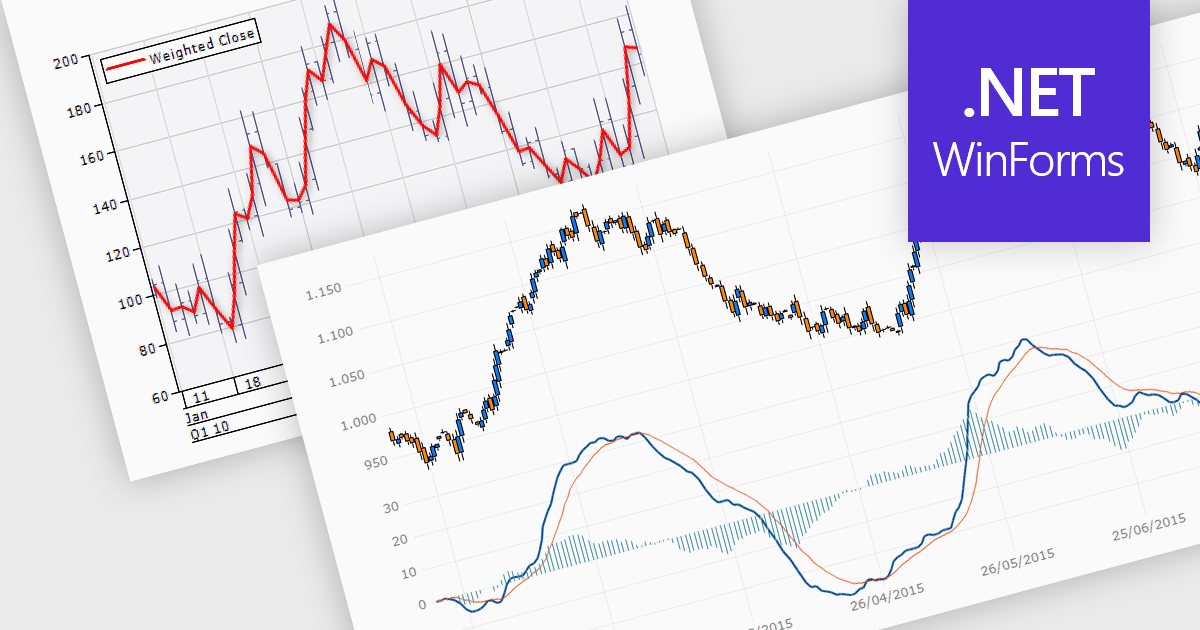
Trend lines are essential tools in data visualization and financial analysis, used to identify and interpret the direction and strength of trends in data sets. A trend line is a line that best represents the data on a chart, highlighting the general direction over a specified period. This is beneficial for making informed decisions, predicting future price movements, and validating the strength of ongoing trends. In stock market analysis, a trend line can help investors determine optimal entry and exit points, while moving averages can signal buy or sell opportunities, enhancing the effectiveness of trading strategies.
Several .NET WinForms chart controls offer trend lines and indicators including:
For an in-depth analysis of features and price, visit our comparison of .NET WinForms chart controls.
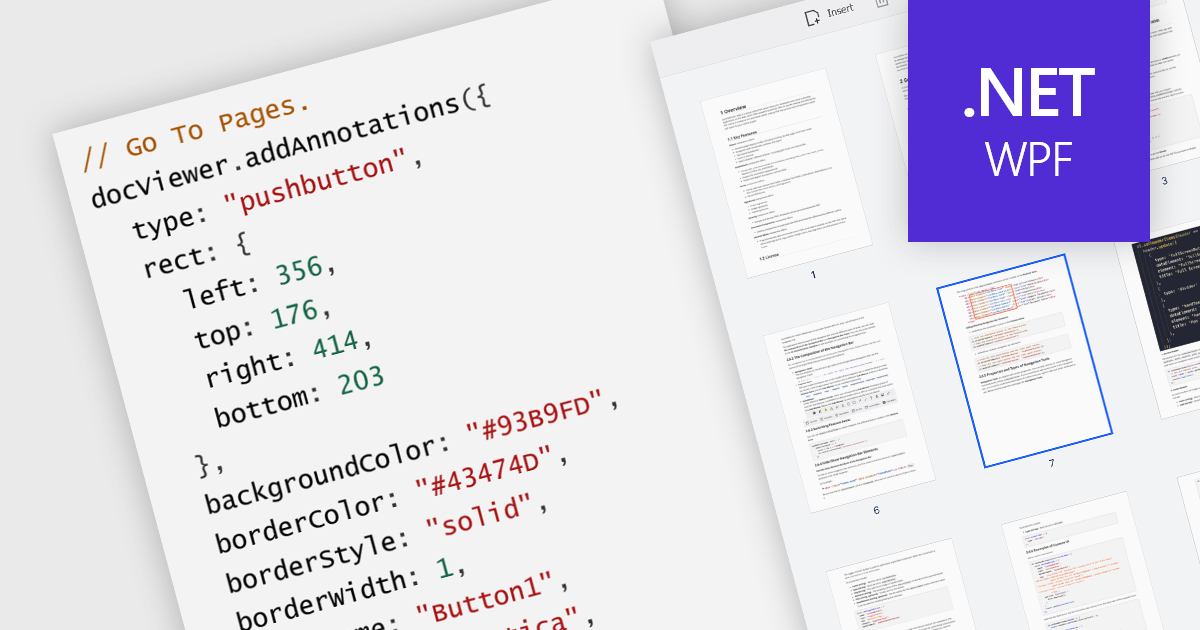
A GoTo action in a PDF component is a clickable link or button that directs users to a specific destination within the same PDF or even a different one. This feature enhances user experience by offering quick jumps to designated parts of the document, references, or connected information. For instance, a table of contents with GoTo actions lets readers instantly access the desired chapter by clicking on the relevant entry. Benefits of the GoTo Action include streamlined document navigation, improved content accessibility, and enhanced interactivity, making it an ideal feature for developing dynamic, user-friendly PDF applications.
Several .NET WPF PDF Components offer GoTo Action including:
For an in-depth analysis of features and price, visit our comparison of .NET WPF PDF Components.
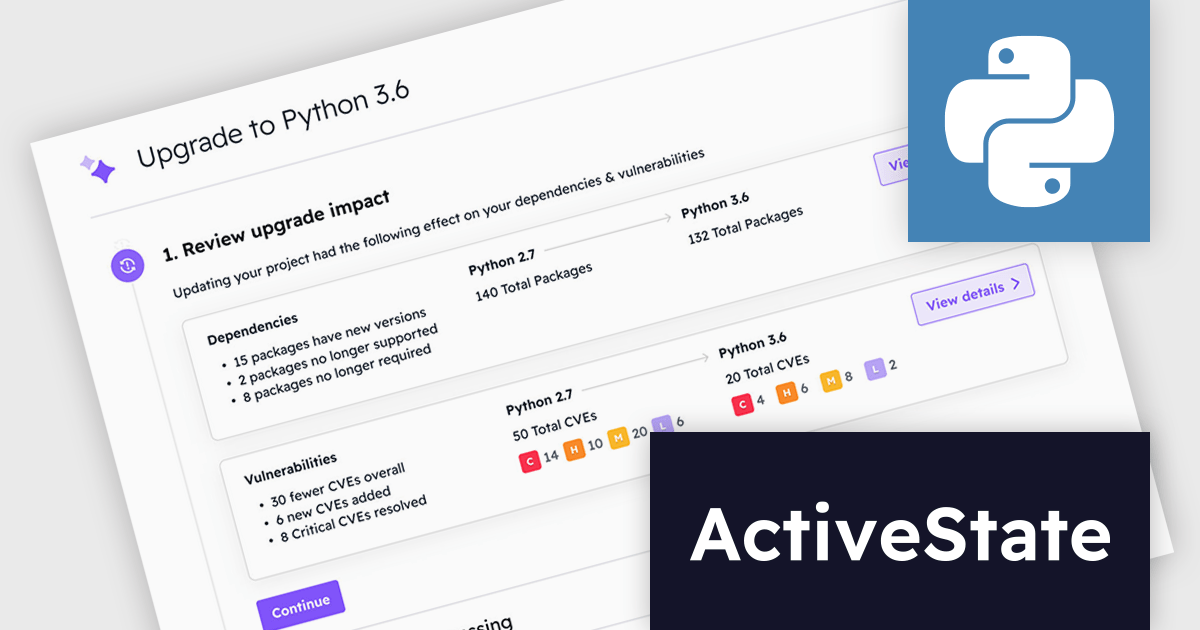
ActiveState Platform is a cloud-based solution that streamlines the secure development, management, and deployment of applications built on Python, Perl, and Tcl. It offers a curated catalog of open-source packages vetted for security and licensing, along with secure build services that create isolated and verifiable runtime environments. This empowers developers to ensure application integrity throughout the development process, from Dev environments to CI/CD pipelines. By simplifying dependency management and guaranteeing consistent environments, ActiveState Platform helps developers improve efficiency, reduce development time, and deliver reliable applications.
ActiveState Platform Enterprise now includes a groundbreaking solution for enterprises struggling to keep pace with the ever-evolving landscape of open-source software. Get Current, Stay Current (GCSC) is a continuous code refactoring service specifically designed to automate updates to Python libraries. This innovative service tackles the challenge of breaking changes, which often occur when libraries are updated and can render existing code inoperable. By automating the refactoring process, GCSC empowers organizations to seamlessly update their software dependencies without sacrificing developer productivity or introducing security vulnerabilities from outdated code.
ActiveState Platform is licensed per developer as an Annual license. See our ActiveState Platform licensing page for full details.
Learn more on our ActiveState Platform product page.
電話: (888) 850 9911
Fax: +1 770 250 6199


