


公式サプライヤー
公式および認定ディストリビューターとして200社以上の開発元から正規ライセンスを直接ご提供いたします。
当社のすべてのブランドをご覧ください。
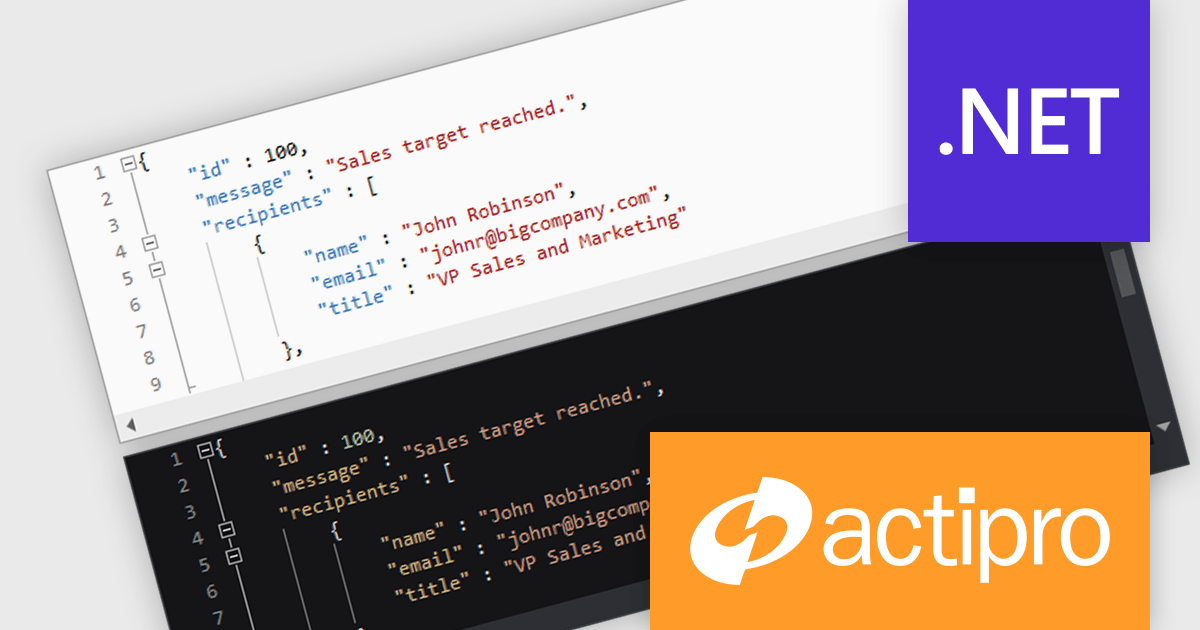
Actipro SyntaxEditor is a sophisticated WPF code editor control designed to provide developers with a seamless way to integrate advanced code editing capabilities into their .NET applications. It offers syntax highlighting for numerous programming languages, code outlining, automated IntelliPrompt (code completion and information tooltips), background parsing, error reporting, and more. This delivers a familiar user experience for developers used to the powerful code editors found in popular IDEs.
The Actipro SyntaxEditor v24.1 release streamlines light and dark theme switching with a dedicated class to manage UI elements, highlighting styles, and icon sets during theme transitions. All built-in syntax languages come with both light and dark highlighting styles, and for custom languages that lack dedicated dark styles, SyntaxEditor automatically converts many common light-themed colors to suitable dark theme equivalents. This comprehensive approach ensures a smooth and visually consistent user experience regardless of the chosen theme.
To see a full list of what's new, see our Actipro SyntaxEditor for WinForms release notes or our Actipro SyntaxEditor for WPF release notes.
Actipro SyntaxEditor is licensed per developer and is available as a Perpetual license with 1 year support and maintenance. See our Actipro SyntaxEditor for WinForms licensing page or our Actipro SyntaxEditor for WPF licensing page for full details.
Learn more on our Actipro SyntaxEditor for WinForms and Actipro SyntaxEditor for WPF product pages.
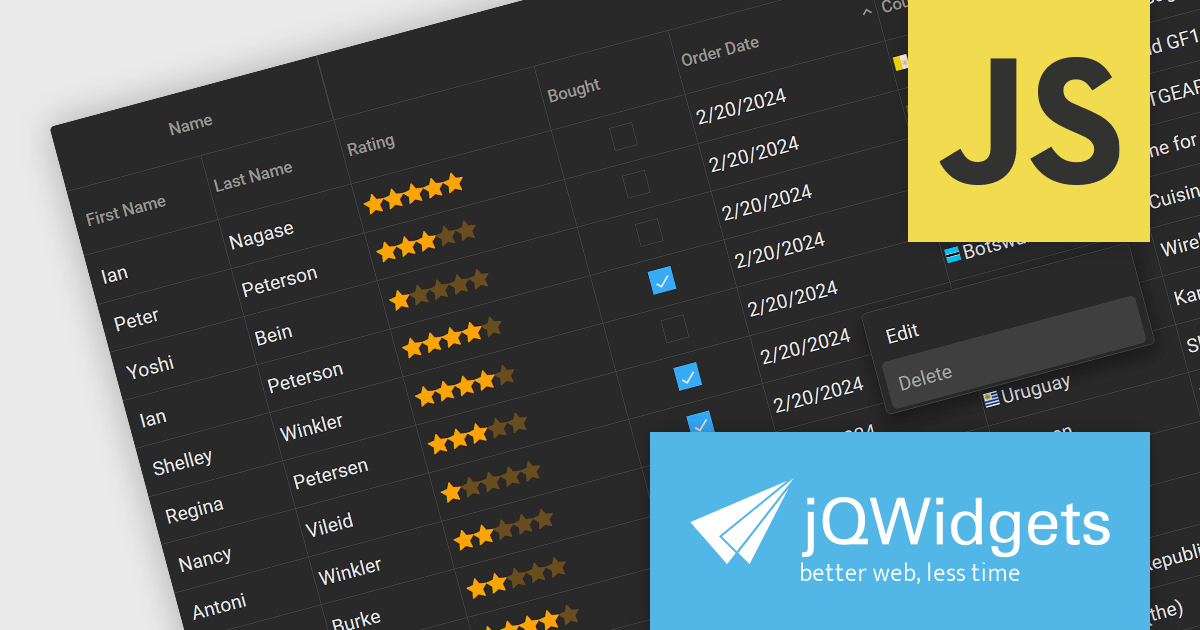
jQWidgets is a comprehensive JavaScript UI framework offering a robust collection of over 60 widgets, themes, and utilities for building professional-grade, cross-platform web applications. Built on jQuery, HTML5, and CSS, it provides extensive functionality including data grids, charts, navigation, input validation, and more. jQWidgets simplifies web development, ensuring your applications work seamlessly across desktop browsers, tablets, and smartphones.
The jQWidgets v19 release introduces a built-in context menu. This menu appears upon right-clicking within the grid, offering users context-specific options relevant to their current selection or interaction. This eliminates the need to navigate to separate menus or tools, streamlining user interactions and significantly improving usability. By providing immediate access to relevant actions within the grid itself, users can work more efficiently and productively. This new addition enhances the overall user experience for anyone working with jqxGrid.
To see a full list of what's new in v19.0.0, see our release notes.
jQWidgets is licensed per developer and is available as a Perpetual license 1 year support and maintenance. See our jQWidgets licensing page for full details.
Learn more on our jQWidgets product page.
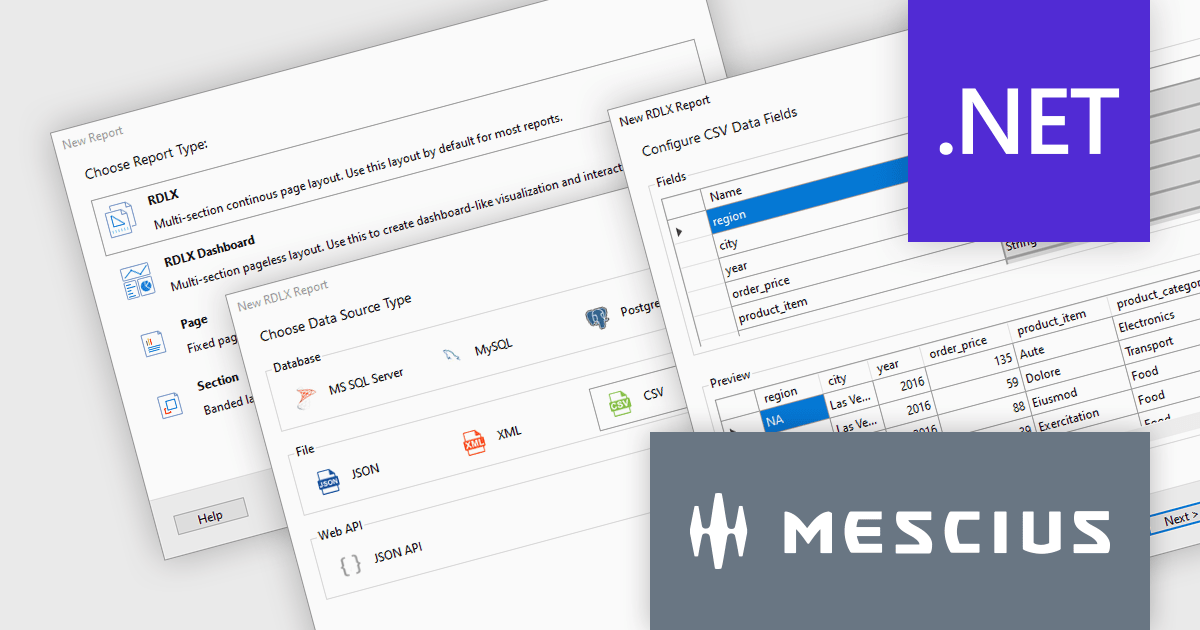
ActiveReports.NET is a reporting tool that allows developers to design and deliver reports with intuitive, reliable, and user-friendly report designers and controls. Features include the ability to create reports in a variety of formats, such as PDF, Excel, and HTML. ActiveReports.NET is also highly customizable, with an extensive API and advanced feature library.
ActiveReports.NET v18 introduces a powerful Report Wizard to streamline the creation of RDLX, Page, and Dashboard reports. This intuitive wizard expertly guides you through the entire report design process, from initial configuration to seamless data binding. Whether you're crafting detailed financial reports, visually rich data dashboards, or any other type of document-based presentation, the wizard ensures a smooth experience. This new feature helps you transform raw data into clear, actionable insights with ease.
To see a full list of what's new in version 18, see our release notes.
ActiveReports.NET is licensed per developer and is available with or without a 12 month support and maintenance subscription. See our ActiveReports.NET licensing page for full details.
For more information, visit our ActiveReports.NET product page.

Setup themes are predefined visual styles and user interface configurations that customize the appearance and flow of the software installation process. These themes allow developers to tailor the installer's look and feel to align with their software branding, provide a seamless user experience, and potentially simplify the installation steps by offering pre-configured settings based on the selected theme. Many installation tools include a variety of built-in themes, along with the ability to create custom themes for advanced control over the installer's aesthetic and functionality. Themed installers contribute to brand recognition and foster a positive perception of the software, ultimately enhancing the software deployment process for both developers and end-users.
Several Installation Tools offer Setup Themes including:
For an in-depth analysis of features and price, visit our comparison of Installation Tools.
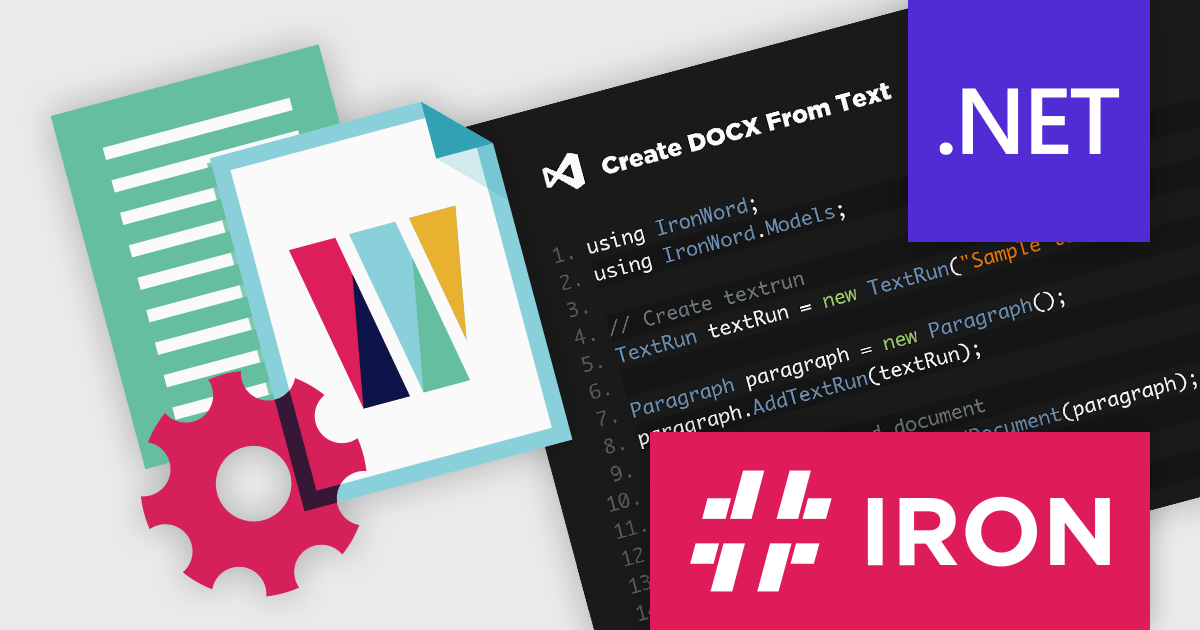
IronWord for .NET empowers developers with a robust and efficient solution for handling Microsoft Word documents within their .NET applications. This C# library eliminates the need for complex Microsoft Office interop, offering a user-friendly API for generating, editing, and formatting DOCX files directly.
By leveraging IronWord for .NET, developers can seamlessly read, edit, and manipulate DOCX files within their .NET projects. Extract text and images, modify page layout elements like paper size and margins, and customize the visual appearance with background colors. Paragraph manipulation allows for adding, removing, and formatting text, incorporating images and shapes, and creating compelling bulleted and numbered lists.
IronWord for .NET also provides comprehensive table functionality. Manage rows and columns with ease, control cell values, merge or split cells for optimal organization, and customize borders with various properties. This extensive feature set empowers developers to seamlessly integrate powerful Word document processing functionalities into their .NET applications, streamlining workflows and enhancing development efficiency.
IronWord for .NET is licensed based on the number of developers, organization locations and projects, and is available as a Perpetual license with one free year of product updates and support services. See our IronWord for .NET licensing page for full details.
IronWord for .NET is available to buy in the following products:
電話: (888) 850 9911
Fax: +1 770 250 6199


