


公式サプライヤー
公式および認定ディストリビューターとして200社以上の開発元から正規ライセンスを直接ご提供いたします。
当社のすべてのブランドをご覧ください。
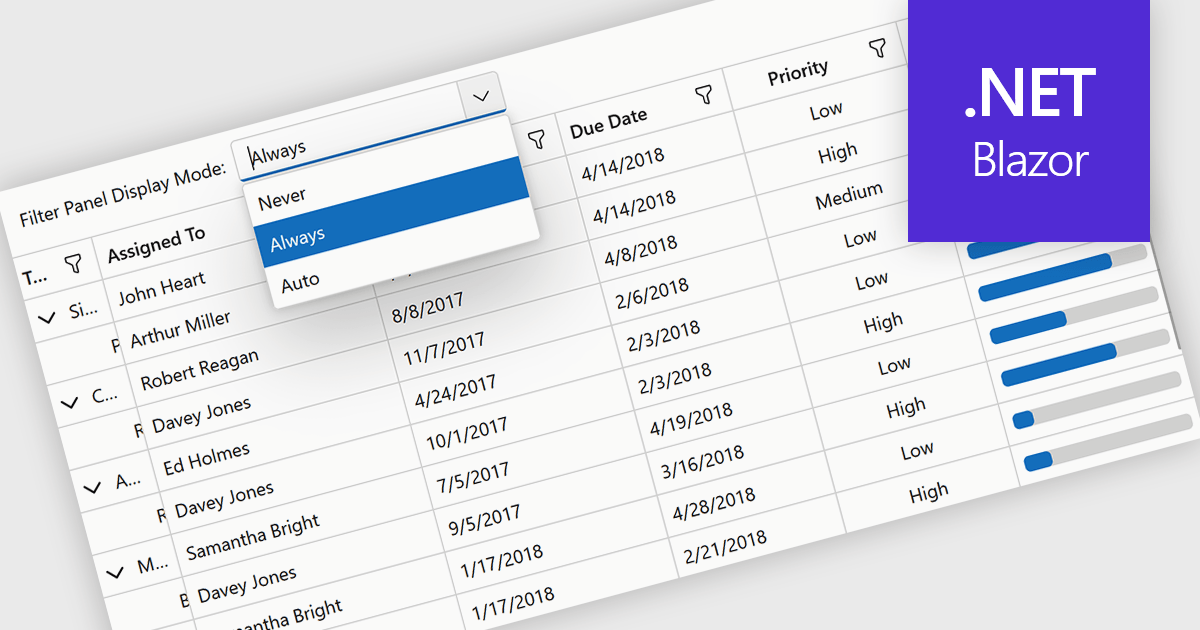
Grid filtering allows users to display only selected rows or columns by choosing specific values, categories, or ranges without modifying the underlying dataset. This capability simplifies navigation through large volumes of data and helps users focus immediately on the most relevant information. By minimizing manual searching and enabling faster comparisons, grid filtering improves productivity and supports more informed decision making. Common use cases include filtering sales data by date range, isolating transactions above a certain value, analyzing results by region or product category, and hiding non essential columns to create clearer, presentation ready reports.
Several .NET Blazor grid controls offer filtering support including:
For an in-depth analysis of features and price, visit our comparison of .NET Blazor grids.
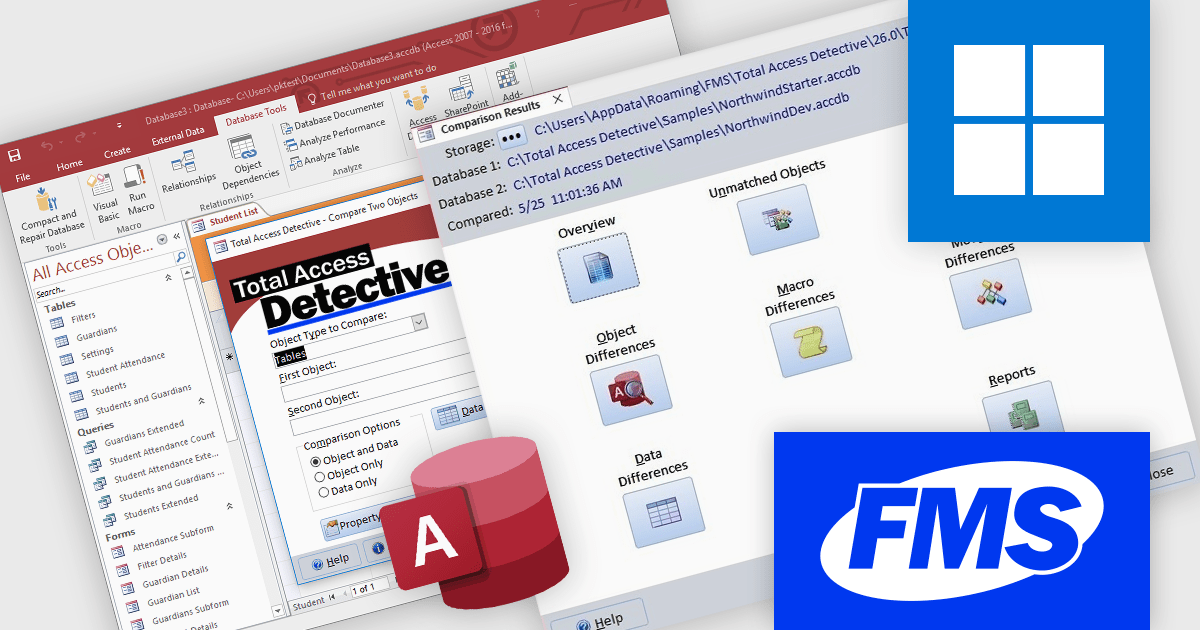
Total Access Detective is an object comparison wizard for Microsoft Access databases that enables developers to quickly identify differences within a single database or between multiple databases. It compares fields, controls, properties, macros, modules, lines of code, table data, and user permissions, clearly highlighting changes between versions. Ideal for version control, upgrades, and multi developer environments, it simplifies troubleshooting, improves accuracy, and helps maintain consistency throughout development.
The Total Access Detective 2026 update improves the two database comparison results form with a simplified, more intuitive layout that helps developers review overall database differences before examining detailed object, macro, module, and data changes. By moving key controls such as overview, unmatched objects, and errors to the top and removing unnecessary text, the update reduces visual clutter, speeds navigation, and enables more efficient and accurate version comparisons in multi developer environments.
To see a full list of what's new in version 2026, see our release notes.
Total Access Detective is licensed on a per user basis and is available as a perpetual license. An optional annual premium support subscription includes senior technical support and point release upgrades during the subscription term. See our Total Access Detective licensing page for full details.
For more information, see our Total Access Detective product page.
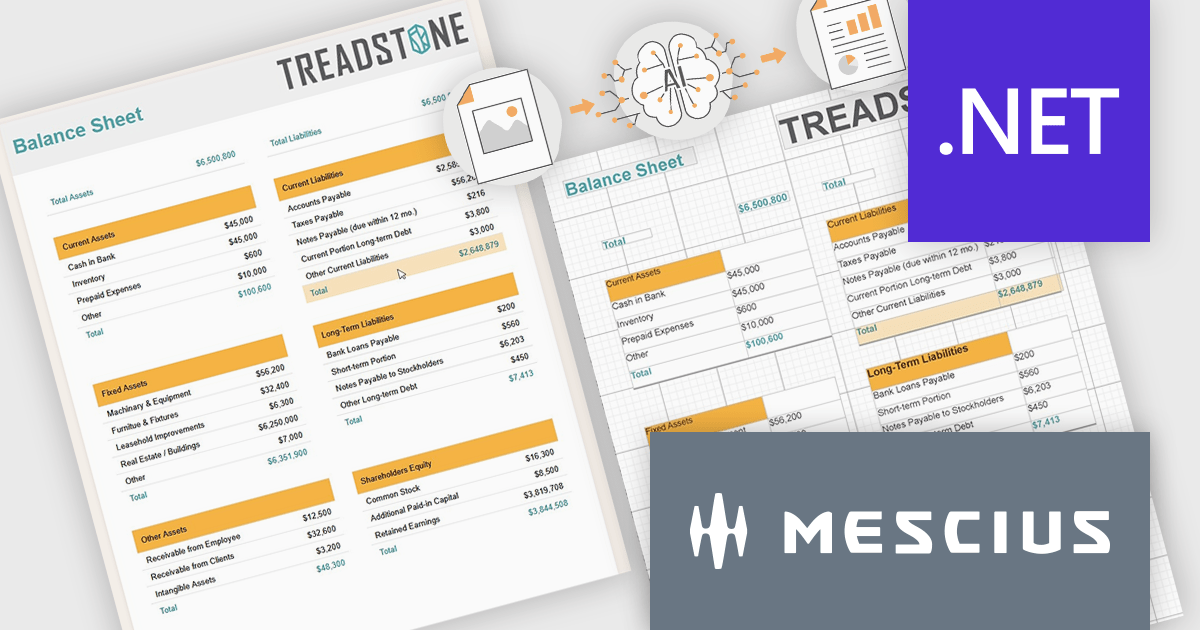
ActiveReports.NET by MESCIUS is a reporting solution for the Microsoft .NET platform that enables developers to create and deliver data-driven reports in web, desktop, and cloud applications. It supports multiple report types, including section, page, and RDL (Report Definition Language) reports, and provides visual designers, a robust rendering engine, and export options such as PDF and Excel. Designed to integrate with modern .NET and ASP.NET Core applications, it helps teams build interactive, enterprise-grade reporting features into their software.
The ActiveReports.NET v20 update introduces a new AI powered image to report capability that enables developers to convert static report images such as screenshots, mockups, PDFs, or even photos of printed pages into fully editable report layouts in minutes. By leveraging Azure Document Intelligence to analyze page structure, text, and visual elements, it significantly reduces the manual effort required to recreate existing reports, accelerates the modernization of legacy assets, and streamlines migrations from other reporting platforms. This capability provides a practical starting point for rebuilding or refining reports while preserving full control over layout structure, styling, grouping, and data bindings to ensure alignment with application architecture and development standards.
To see a full list of what's new in v20, see our release notes.
ActiveReports.NET is licensed per developer. Dependent on geographic location it is available as either an Annual (Timed) Subscription License or as a Perpetual Developer License which comes with 1 year of software updates and support. Each developer requires a license to design, develop, or maintain applications. The Annual Subscription License must be renewed each year to continue to work with the software. Published applications are royalty free and do not expire. Optional pipeline licenses available for CI/CD build servers. See our ActiveReports.NET licensing page for full details.
Learn more on our ActiveReports.NET product page.
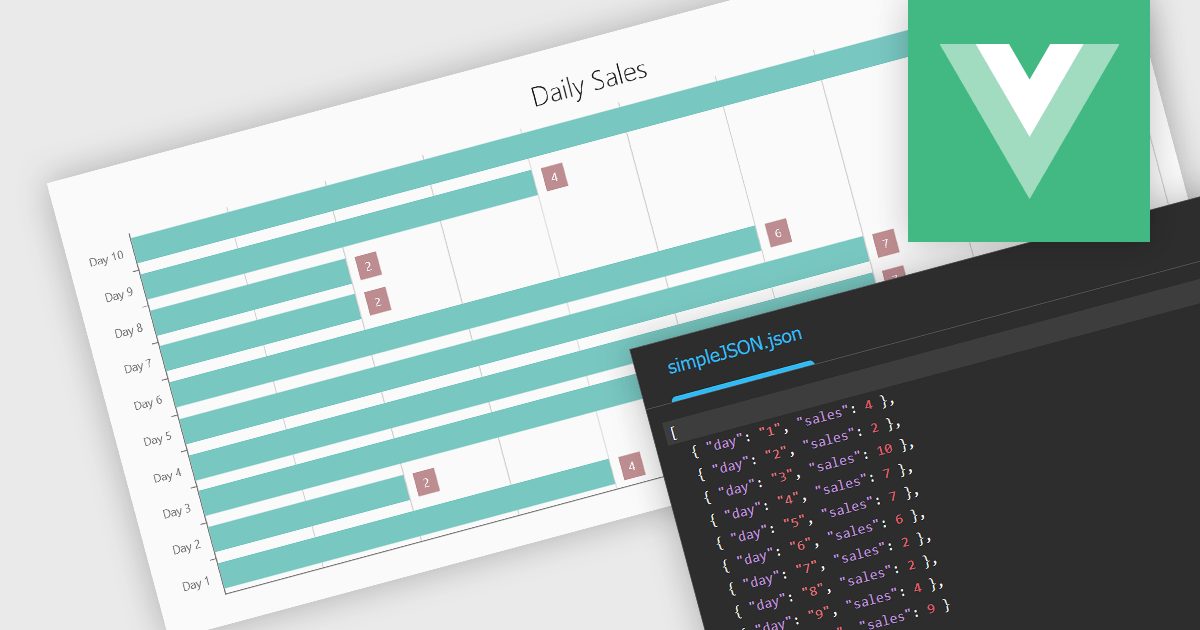
Using JSON (JavaScript Object Notation) as a data source for charts allows applications to bind structured, lightweight data directly to visualization components. JSON represents data as objects and arrays, making it well suited to defining categories, series, and individual data points in a format that aligns naturally with modern web development practices. Its widespread use in RESTful APIs and web services enables charts to consume live or remote datasets efficiently, while reducing the need for complex data transformation before rendering.
Several Vue.js chart components allow you to use JSON as a data source, including:
For an in-depth analysis of features and price, visit our comparison of Vue.js charting components.
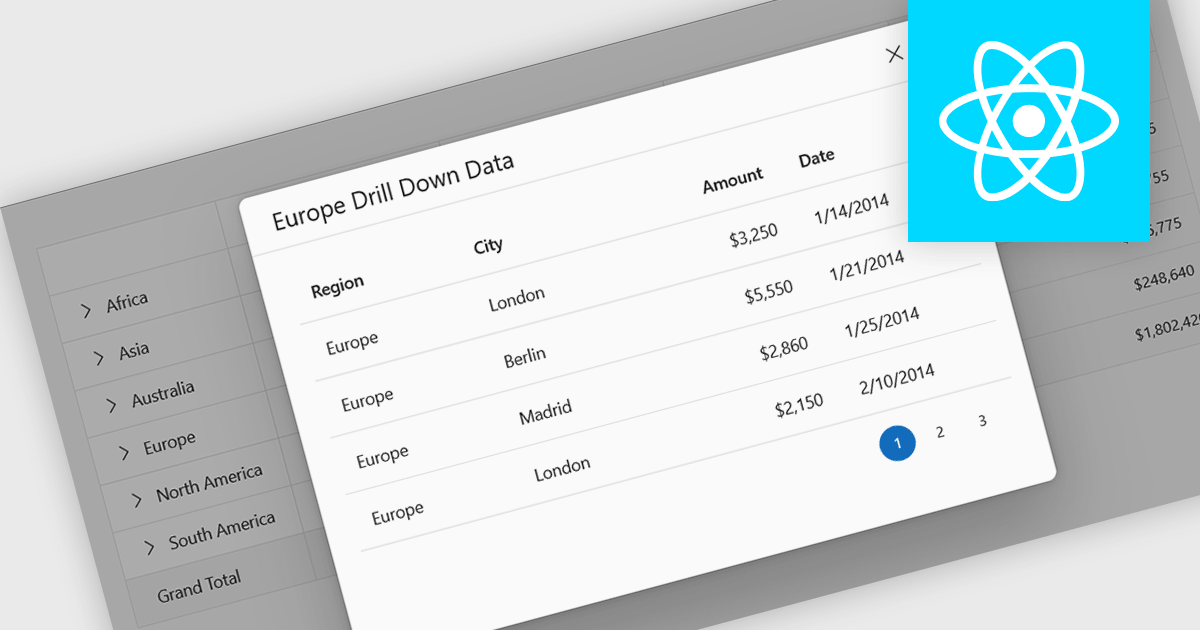
Drill-down support in a grid component allows users to move from summarized data to more detailed records within the same interface, often by expanding rows or selecting linked values that reveal related data. Instead of navigating to a separate page or view, users can access underlying information directly in context. For developers, this reduces the need for additional navigation and simplifies the presentation of hierarchical or related datasets. It also makes it easier to analyze data step by step, helping users inspect specific records or relationships without losing their place in the overall dataset.
Several React grid controls support drill-down features including:
For an in-depth analysis of features and price, visit our React grid controls comparison.
電話: (888) 850 9911
Fax: +1 770 250 6199


