


公式サプライヤー
公式および認定ディストリビューターとして200社以上の開発元から正規ライセンスを直接ご提供いたします。
当社のすべてのブランドをご覧ください。
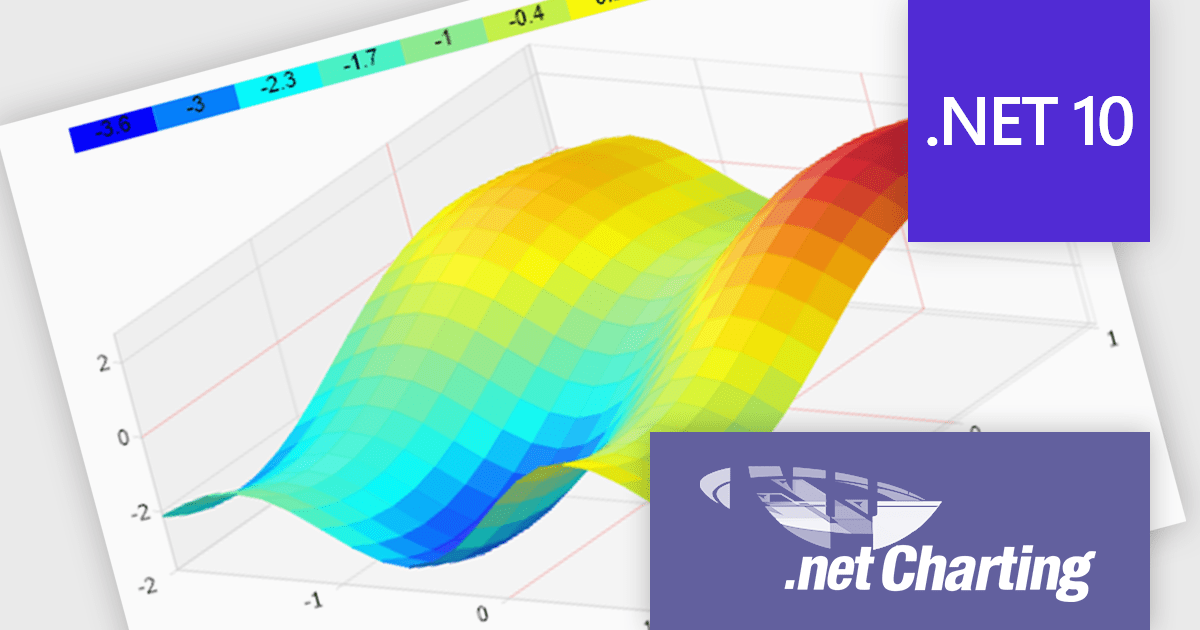
.netCHARTING is a comprehensive charting solution designed for C# and VB.NET developers working with ASP.NET or WinForms. It enables the rapid creation of dynamic, data-driven charts with minimal coding effort. Built entirely with managed C# code, .netCHARTING seamlessly integrates data access, aggregation, and visualization, allowing developers to generate interactive and visually compelling charts from various data sources, including SQL Server, Oracle, and MySQL. The platform supports a wide array of chart types - such as bar, line, pie, and geographic maps - and offers features like JavaScript and HTML5 charting for enhanced interactivity across devices, including mobile platforms. By automating complex tasks like date handling and data aggregation, .netCHARTING simplifies the development process, enabling professionals to deliver insightful data visualizations efficiently.
The .netCHARTING 10.8 release introduces official .NET 10 support with a dedicated NuGet package and sample bundle that run on the latest Microsoft tooling, enabling developers to build and optimize visualizations on the newest cross-platform .NET platform. This update ensures compatibility with the latest Visual Studio 2026 and Windows Server environments, letting teams leverage the performance and productivity improvements of .NET 10 in their charting solutions while continuing to benefit from a mature, feature-rich chart control.
.netCHARTING is licensed per site (1 web site on 1 server), per server (unlimited web sites on 1 server) or per developer (single application) and is available as a perpetual license with a 12 month subscription which includes major and minor upgrades and priority email support. See our .netCHARTING licensing page for full details.
For more information, visit our .netCHARTING product page.
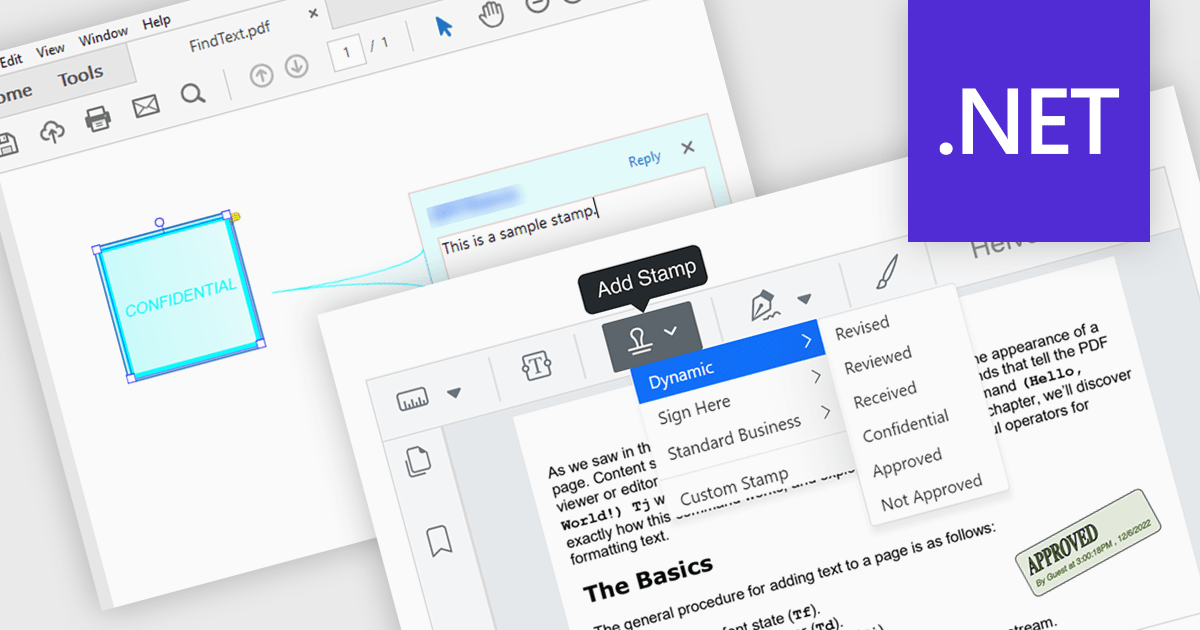
Stamp annotation support in a PDF Viewer component allows applications to place predefined or custom visual marks, such as “Approved,” “Draft,” or date-based stamps, directly onto PDF pages as non-destructive annotations. For software developers, this capability simplifies the implementation of document review and approval processes by enabling users to apply consistent, repeatable markings without altering the underlying content. It improves traceability and collaboration by making document status and actions immediately visible, supports automation through programmatic stamp placement, and helps maintain document integrity while meeting common business and compliance requirements.
Several .NET PDF viewer components support stamp annotations, including:
For an in-depth analysis of features and price, visit our comparison of .NET PDF viewer components.
Skyvia Data Integration is a cloud-based platform that provides a unified environment for managing data pipelines, ETL processes, and data synchronization between various data sources and destinations. It offers a low-code interface for creating and configuring data integration workflows, automating routine tasks, and ensuring data consistency across different systems. The platform supports a wide range of data formats and protocols, including relational databases, MySQL databases, cloud storage, and APIs, making it a versatile tool for data professionals and developers.
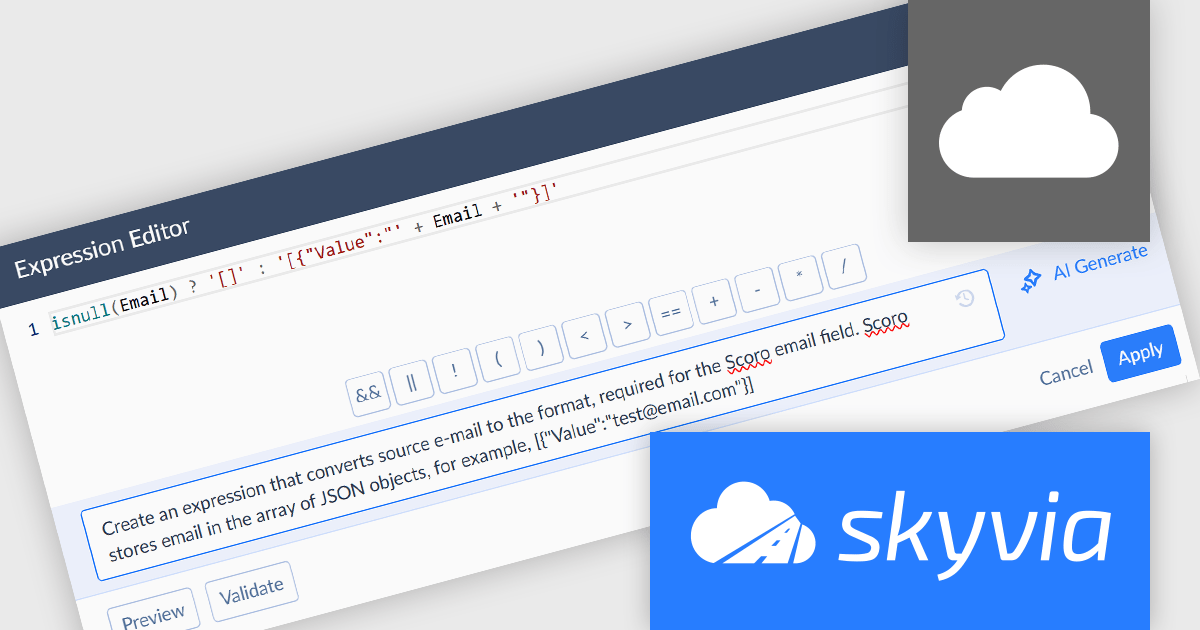
The latest Skyvia Data Integration release introduces AI powered expression generation, enabling developers to describe the intended transformation logic in natural language and automatically generate accurate expressions directly within the Expression and Mapping editors. This capability reduces the time spent manually writing and validating complex formulas, lowers the risk of syntax and logic errors, and simplifies the implementation of advanced data transformations. By accelerating expression creation and reducing dependency on detailed knowledge of Skyvia’s expression syntax, the feature helps development teams build, modify, and maintain integration and automation workflows more efficiently.
To see a full list of what's new, see our release notes.
Skyvia Data Integration is licensed based on the number of records processed per month and is available as an Annual License. See our Skyvia Data Integration licensing page for full details.
Learn more on our Skyvia Data Integration product page.
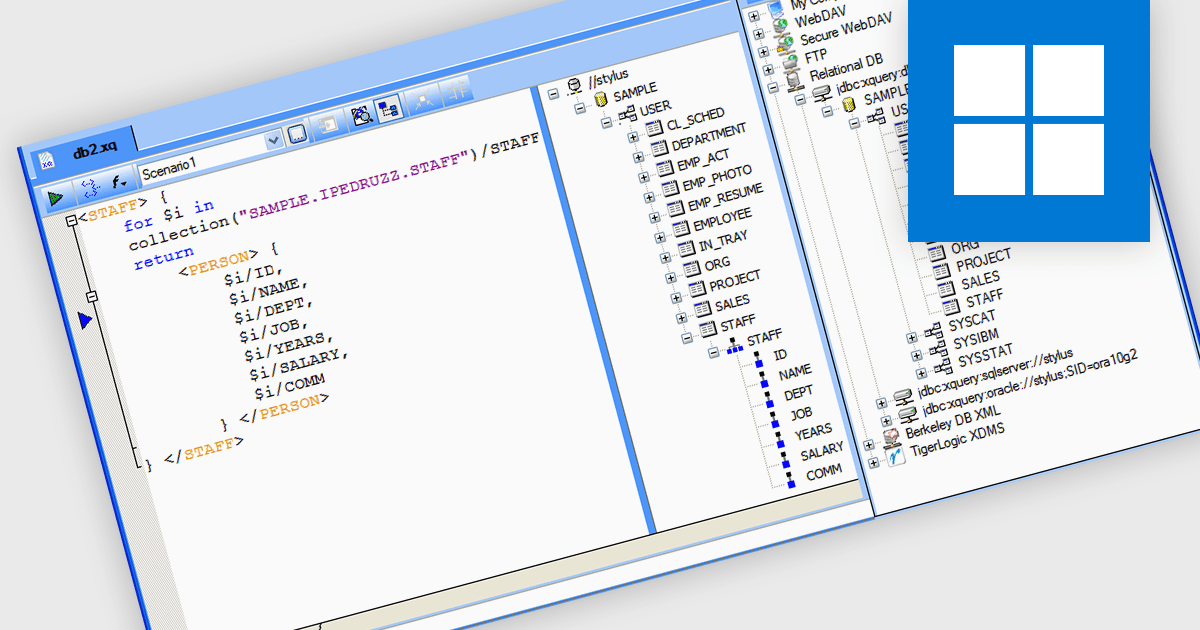
IBM DB2 database support in Structured Document Tools refers to the ability of XML and data development software to connect directly to IBM DB2 relational databases for accessing, querying, and integrating structured data within document-based processes. This support enables users to generate or validate XML and other structured documents against DB2 data, perform database-driven transformations, map DB2 content into XML schemas, and design reports or outputs based on live enterprise database information. By providing built-in connectivity to IBM DB2, these tools help organizations improve data exchange, ensure consistency between structured documents and backend systems, and support complex publishing, integration, and compliance processes in DB2-based environments.
Several structured document tools support IBM DB2 including:
For an in-depth analysis of features and price, visit our comparison of structured document tools.
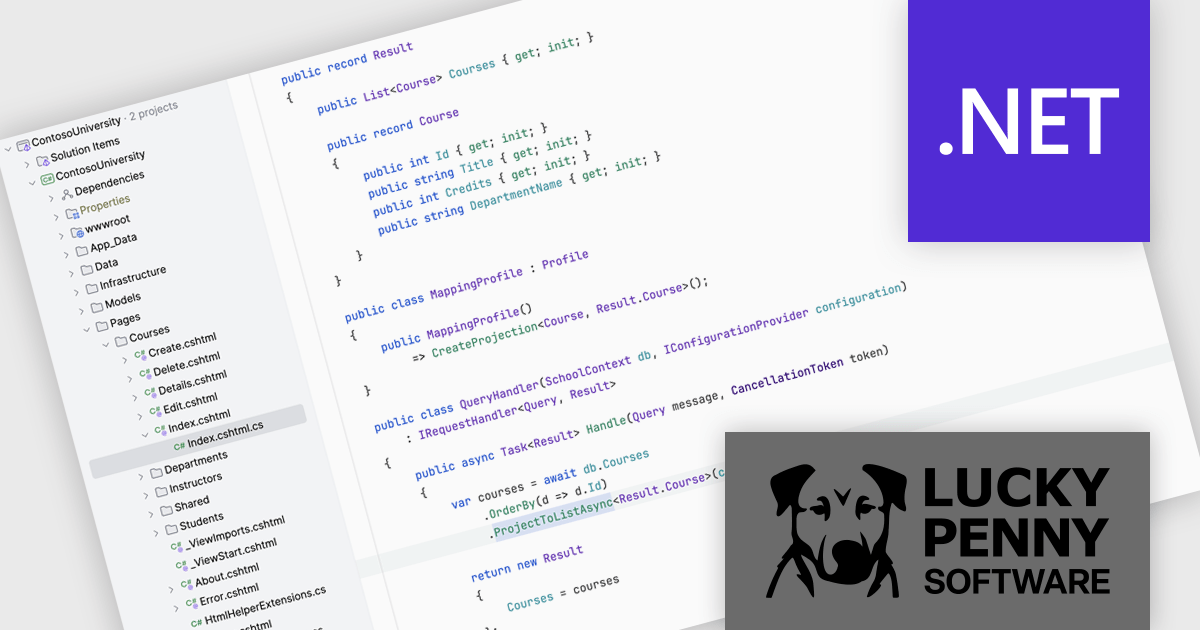
AutoMapper by Lucky Penny Software is a convention-based object-to-object mapping library designed for Microsoft .NET developers. It improves the process of transforming data between objects, particularly when mapping complex domain models to simpler Data Transfer Objects (DTOs), using intelligent conventions and configuration options to minimize manual coding.
By eliminating repetitive boilerplate mapping code, AutoMapper helps developers build cleaner, more maintainable applications. It enforces consistent naming conventions, validates mappings at runtime, and optimizes LINQ projections for efficient data querying. This makes it especially valuable in layered architectures, API development, and enterprise applications where data transformation is frequent and complex. From startups to large organizations, teams use AutoMapper to reduce errors, accelerate development cycles, and focus on delivering business value rather than managing tedious object-mapping logic.
AutoMapper is licensed on an annual subscription basis per development team, with Standard (1–10 developers), Professional (11–50 developers), and Enterprise (unlimited developers) tiers. See our AutoMapper licensing page for full details.
For more information, visit our AutoMapper product page.
電話: (888) 850 9911
Fax: +1 770 250 6199


