


公式サプライヤー
公式および認定ディストリビューターとして200社以上の開発元から正規ライセンスを直接ご提供いたします。
当社のすべてのブランドをご覧ください。
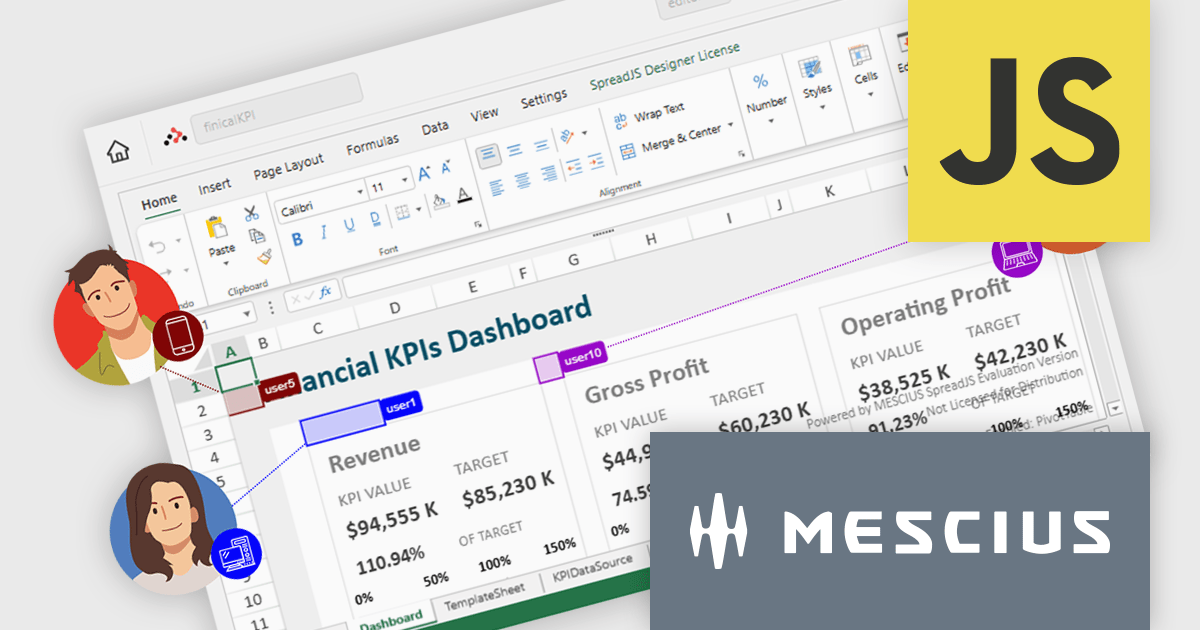
SpreadJS is a complete enterprise JavaScript spreadsheet solution used to create financial reports and dashboards, budgeting and forecasting models, scientific, engineering, healthcare, education, science lab notebooks, and other similar JavaScript business applications. It leverages a high-speed calculation engine with over 500 Excel built-in functions in 19 languages to deliver true Excel-like spreadsheet experiences with zero dependencies on Excel and full support for React, Vue, Angular, and TypeScript.
On Thursday, February 26th at 11:00 AM EST, MESCIUS (formerly GrapeCity) will be presenting a CodeClinic Live Webinar highlighting the new Collaboration Server as a production-ready solution for real-time, multi-user spreadsheet editing in enterprise JavaScript applications. During this webinar, SpreadJS Product Manager Chris Bannon and Product Marketing Manager Mackenzie Albitz will take you through the following key takeaways:
Register for the Live Webinar today and mark your calendar for February 26th.
SpreadJS is licensed per developer and includes 1 Year Maintenance (major and minor version releases and unlimited support phone calls). SpreadJS requires an Annual or Perpetual Deployment License. The optional Add-ons are available at an additional cost, and require a SpreadJS license. See our SpreadJS licensing page for full details.
For more information, visit our SpreadJS product page.
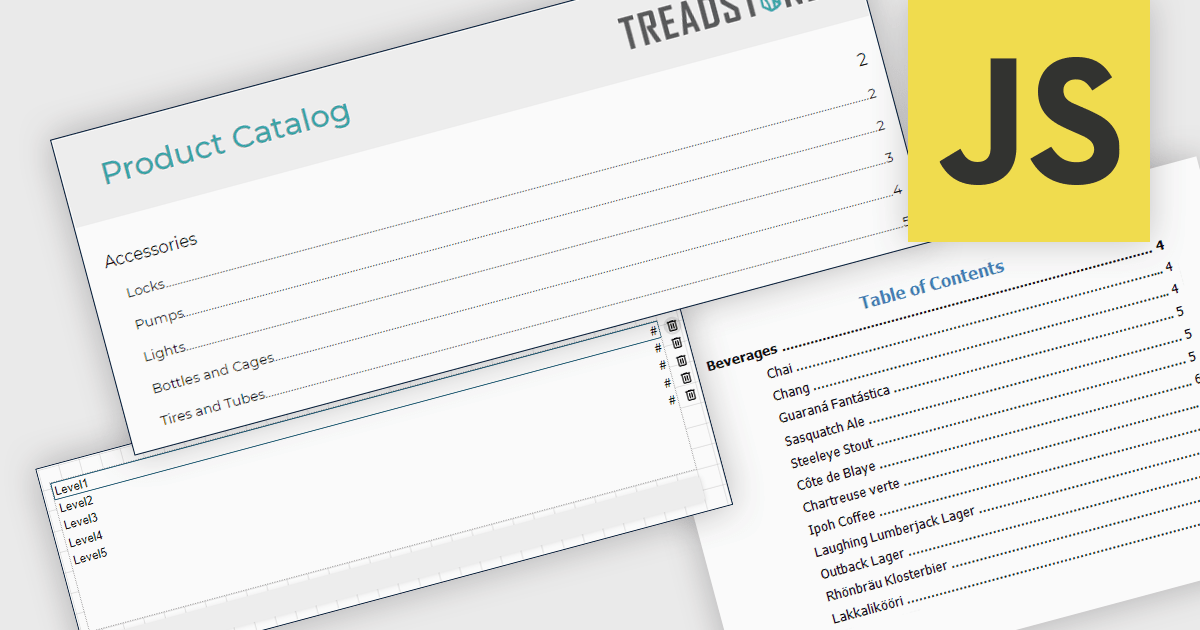
A table of contents in a report is a structured list of sections and subsections that provides an organized overview of the document's content. It typically reflects the report's hierarchy and allows readers to navigate quickly to specific sections, either through page references in printed formats or clickable links in digital formats. This functionality improves usability by reducing the time required to locate information, supporting clearer document structure, and making complex or lengthy reports easier to understand and manage. For organizations that distribute detailed analytical or operational reports, a table of contents contributes to a more professional presentation and a more efficient review process.
Several JavaScript reporting components allow you to add a table of contents, including:
For an in-depth analysis of features and price, visit our comparison of JavaScript reporting components.
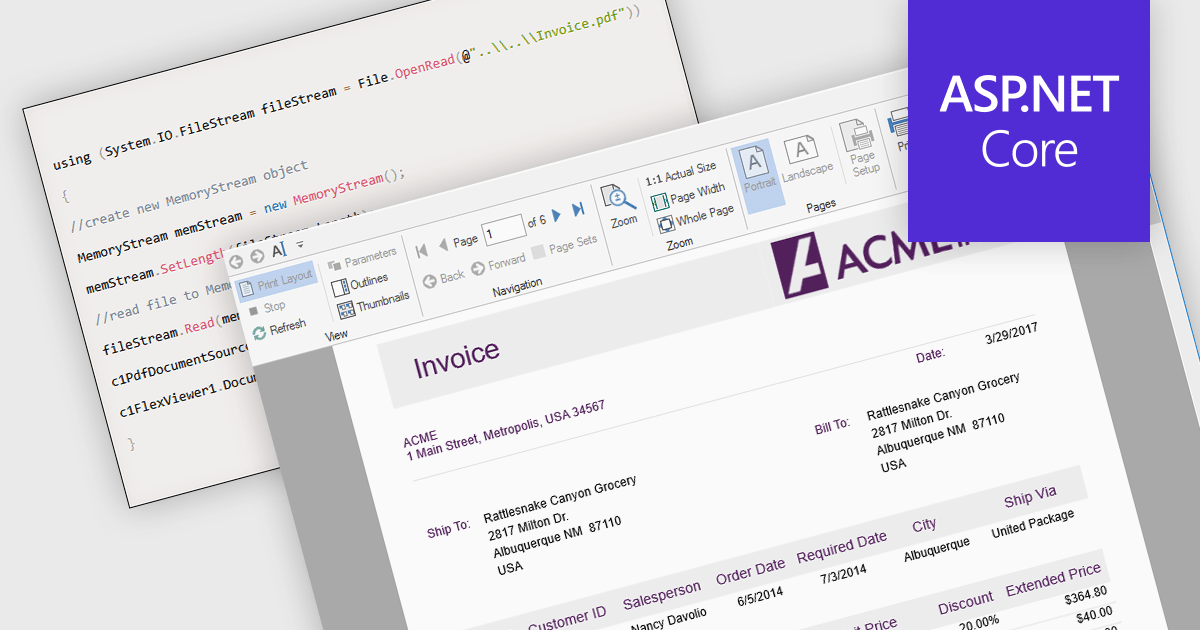
Opening PDFs directly from streams in ASP.NET PDF Viewer components refers to the ability to load and render PDF documents from a .NET Stream object rather than from a physical file stored on the server. This means the PDF content can be retrieved dynamically from sources such as databases, cloud storage, web APIs, or generated in memory at runtime, and then passed directly to the viewer for display. By working with streams, applications can avoid temporary file storage, improve security by reducing file system exposure, and better support modern deployment scenarios such as containerized or cloud-based environments where local storage may be limited or transient.
Several ASP.NET Core PDF viewer components offer open PDFs from stream functionality including:
For an in-depth analysis of features and price, visit our comparison of ASP.NET Core PDF viewer components.
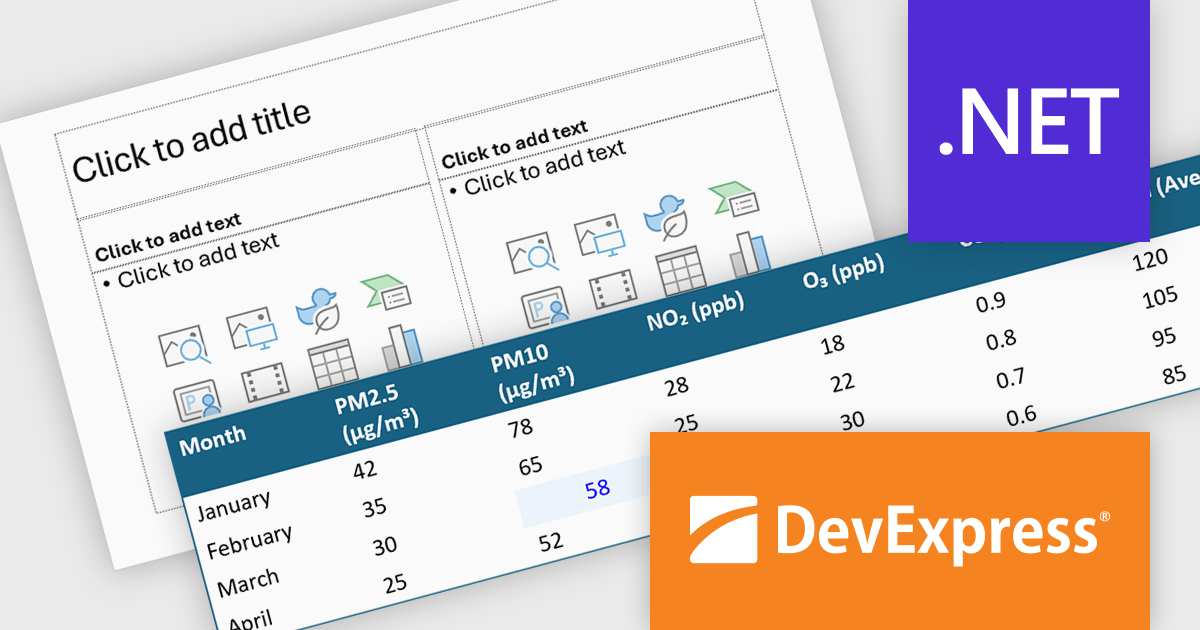
DevExpress Office File API is a robust library designed to simplify the creation, editing, and processing of popular office document formats, including Word, Excel, PowerPoint, and PDF. It allows developers to integrate advanced document management features into their applications without relying on external software like Microsoft Office. Key features include document generation, data import/export and template customization. The API supports advanced formatting, encryption, and digital signatures, ensuring secure and professional-grade output.
The DevExpress Office File API now includes full support for PowerPoint tables, allowing applications to upload and save presentations that contain tabular data and interact with that data through code. Developers can read existing tables, modify their structure and content, remove tables that are no longer needed, or create entirely new tables from scratch. This addition makes it easier to automate report generation, update presentation data, and integrate PowerPoint files into document processing workflows where tables play a central role.
DevExpress Office File API is licensed per developer and is available as a Perpetual License with a 12 month support and maintenance subscription. See our DevExpress Office File API licensing page for full details.
DevExpress Office File API is available individually or as part of DevExpress Universal.
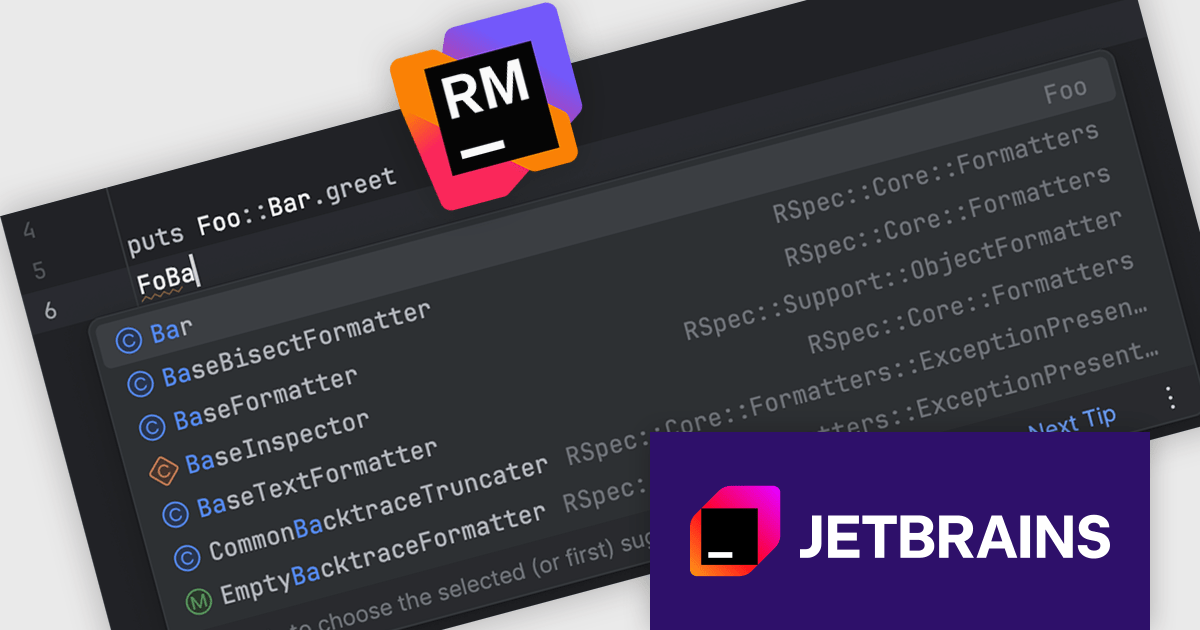
RubyMine by JetBrains is a Integrated Development Environment (IDE) specifically designed for Ruby and Ruby on Rails development. It offers a comprehensive suite of features to improve your coding efficiency, including smart code completion, syntax highlighting, code refactoring tools, built-in debugging and testing frameworks, and integration with popular libraries and databases. Whether you're a seasoned Rails developer or just starting out, RubyMine's intuitive interface and robust features can help you write cleaner, more maintainable code and accelerate your development.
The RubyMine 2025.3 release enhances code completion for qualified constants by introducing fuzzy search across namespaces. This lets developers type partial names, such as "FoBa", and receive accurate suggestions like "Foo::Bar", even when dealing with deeply nested structures. The update helps speed up navigation and code writing in projects with large or hierarchically organized modules, making it easier to locate and use the right constants with minimal input.
To see a full list of what's new in version 2025.3, see our release notes.
RubyMine is licensed per user, and is available as a commercial annual subscription license. We can supply new subscriptions, subscription renewals, lapsed renewals, and additional user licenses. See our RubyMine licensing page for full details.
RubyMine is available to buy in the following products:
電話: (888) 850 9911
Fax: +1 770 250 6199


