


公式サプライヤー
公式および認定ディストリビューターとして200社以上の開発元から正規ライセンスを直接ご提供いたします。
当社のすべてのブランドをご覧ください。

dbForge Studio for MySQL is a comprehensive tool for MySQL and MariaDB database development, management, and administration. It provides a wide range of features for database design, development, and administration, including visual tools for creating and editing database objects, a powerful SQL query editor, and tools for data manipulation, analysis, and synchronization. dbForge Studio is available for Windows, macOS, and Linux platforms.
dbForge Studio for MySQL V10 simplifies and streamlines team-driven database management by integrating with various popular version control systems, including Azure DevOps Server, Apache Subversion (SVN), TFVC, Git (including GitHub, GitLab, and Bitbucket), Mercurial (Hg), Perforce (P4), and SourceGear Vault. It enables version control of database schemas, static table data, and database changes under various development models. Users can commit, revert, and review changes, resolve conflicts, compare database versions, and view change history. This new support for source control makes managing database changes and collaboration easier than ever.
To see a full list of what's new in version 10.0.46, see our release notes.
For more information, visit our dbForge Studio for MySQL product page.
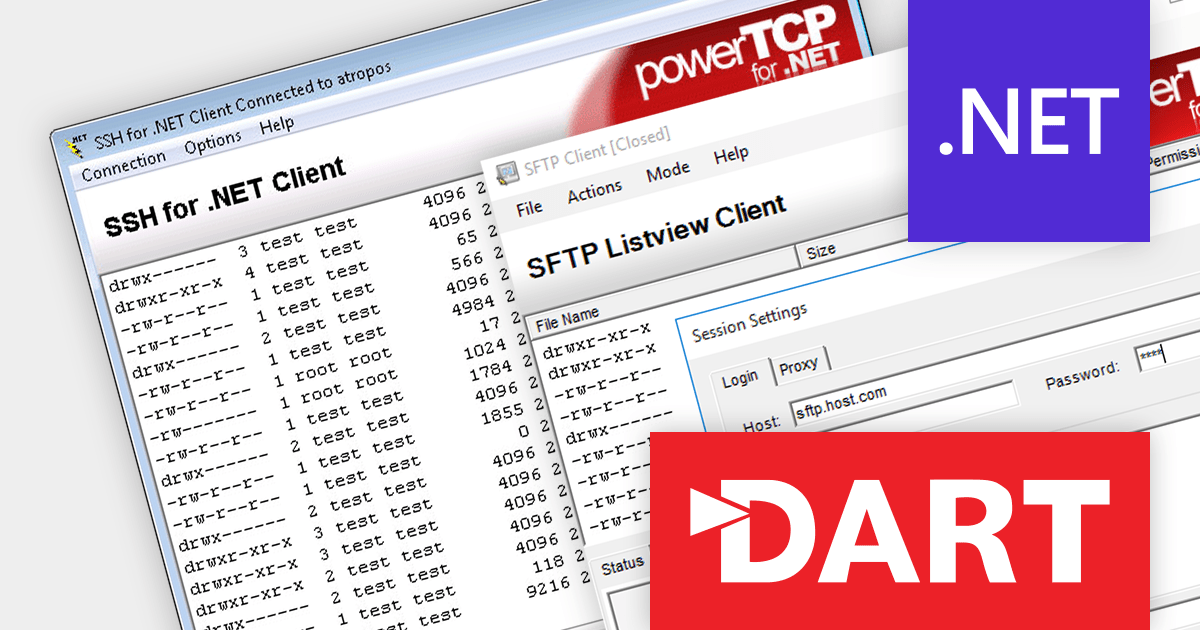
PowerTCP SSH and SFTP for .NET by Dart Communications is a comprehensive suite of SSH-2 and SFTPv3 components for the .NET Framework, providing developers with the tools they need to add secure remote access and file transfer capabilities to their applications.
The 7.0.0.3 release bolsters server security with support for RSA-SHA2-256, RSA-SHA2-384, and RSA-SHA2-512 host key algorithms. This technology offers stronger protection against cryptographic attacks compared with the previously used RSA-SHA1. By employing these enhanced algorithms, you can effectively safeguard your servers from a range of sophisticated attacks, including collision, preimage, and second preimage attacks.
To see a full list of what's new in version 7.0.0.3, see our release notes.
For more information, visit our PowerTCP SSH and SFTP for .NET product page.
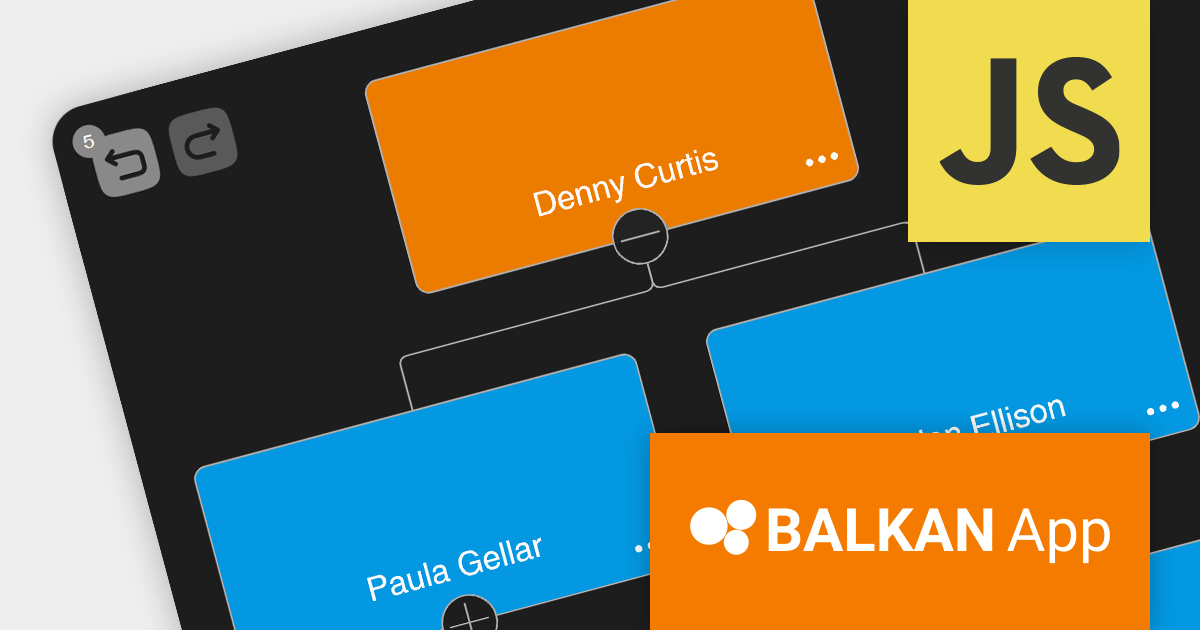
OrgChart JS is a visual tool that helps managers illustrate the roles and hierarchy of an organization. It supports a variety of features, including grouping, assistant nodes, expand/collapse, search, performance, and multi-format exports for example to PDF, PNG, SVG or CSV.
The v8.12.13 release of OrgChart JS introduces undo/redo functionality, allowing users to easily reverse or repeat actions like adding or removing nodes, even after saving the chart. The undo/redo stack can be cleared to remove unnecessary steps or start fresh. Additionally, the number of steps in the stack can be checked for a clear overview of the history. Undo/redo history is stored in the browser's session storage, ensuring actions remain available even after refreshing or closing the browser. For extra security, this history can optionally be saved to a database, providing a permanent record of changes.
To see a full list of what's new in v8.12.13, see our release notes.
For more information, see our OrgChart JS product page.
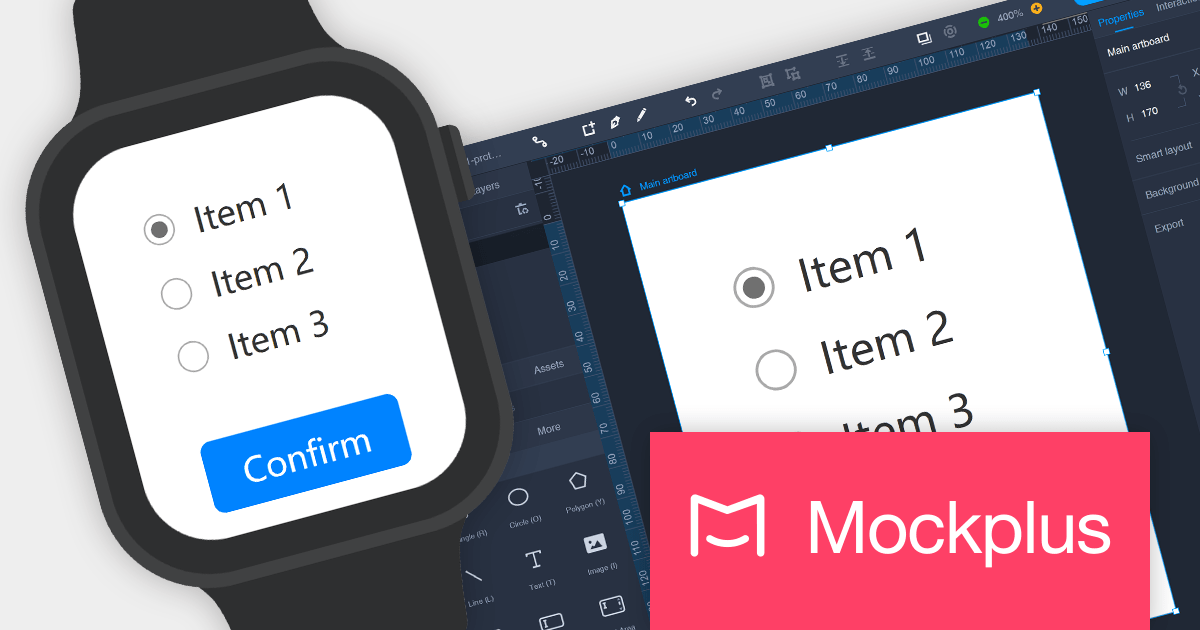
Mockplus Cloud streamlines the design collaboration and hand-off process, empowering product design teams to work seamlessly, centralize designs, and deliver high-converting products with greater efficiency. It keeps every team member informed and streamlines the entire design-to-development workflow, fostering enhanced collaboration and accelerating product delivery.
The latest release of Mockplus Cloud adds the ability to show frames for Apple Watch and Car Infotainment projects. Available in both Preview and Presentation modes, these new frames make it easier for users to visualize designs in context with a more immersive preview.
To see a full list of what's new in the October 2023 release, see our release notes.
For more information, visit our Mockplus Cloud product page.
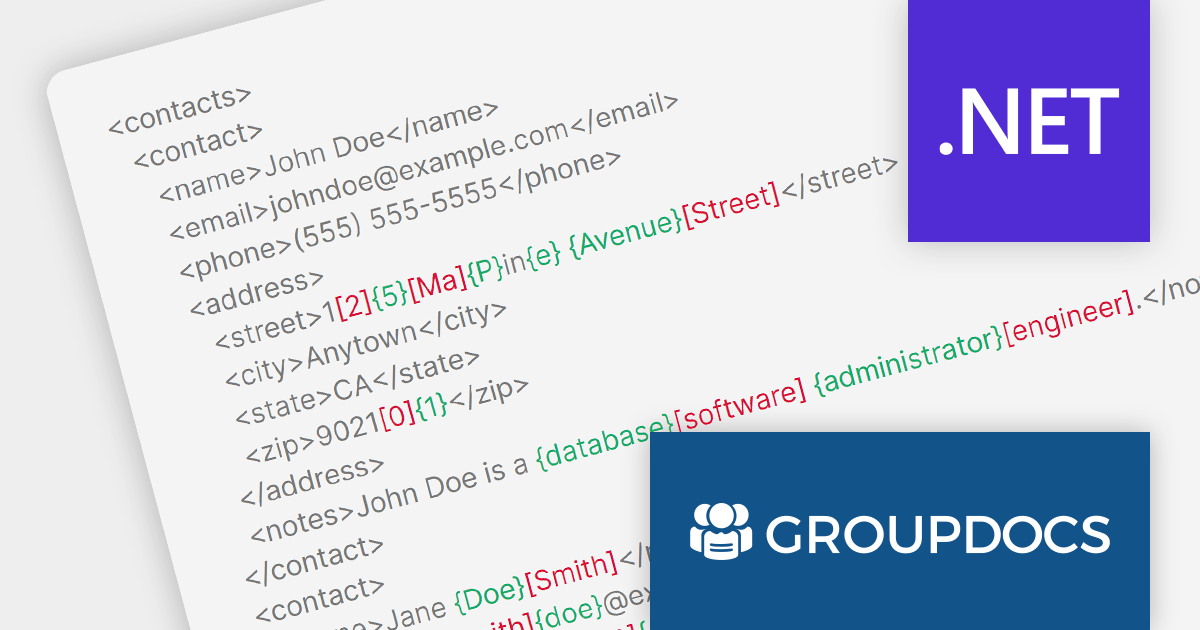
GroupDocs.Comparison for .NET is a comprehensive document comparison library that enables developers to seamlessly compare and merge various document formats within their .NET applications. It provides a rich set of features to effectively detect and highlight differences between documents.
GroupDocs.Comparison for .NET 23.10 adds the ability to compare and merge XML documents. It can detect changes at the word, element, and attribute levels, making it easy to identify and resolve differences between two XML files. Comparing XML files is an essential task in various domains including software development, data management, and document processing. It can help organizations maintain data integrity, ensure consistency, identify discrepancies, and resolve conflicts, ultimately contributing to the overall quality, efficiency, and reliability of their operations.
To see a full list of what's new in version 23.10, see our release notes.
For more information, visit our GroupDocs.Comparison for .NET product page.
電話: (888) 850 9911
Fax: +1 770 250 6199


