


公式サプライヤー
公式および認定ディストリビューターとして200社以上の開発元から正規ライセンスを直接ご提供いたします。
当社のすべてのブランドをご覧ください。
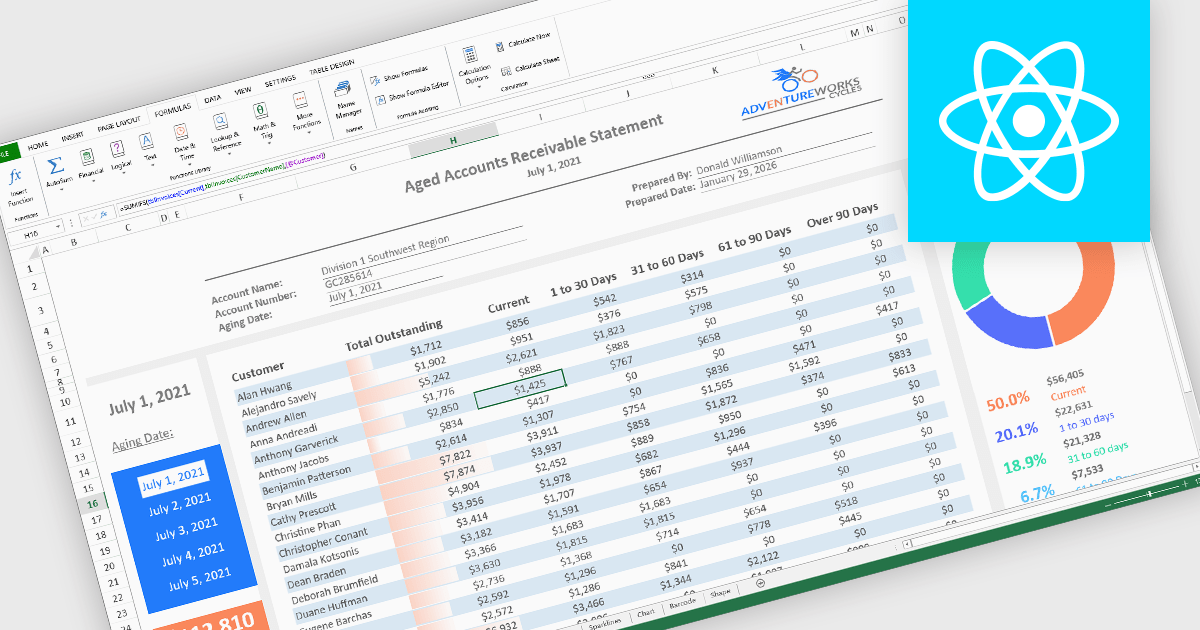
Formulas, calculations, and logic features form the analytical core of spreadsheet components, enabling data to be transformed into meaningful insights. These capabilities allow spreadsheets to move beyond static data entry by supporting dynamic calculations, rule-based behavior, and real-time feedback as data changes. A robust implementation ensures accuracy, consistency, and performance, making spreadsheets suitable for everything from simple models to complex, enterprise-grade analytical scenarios.
Common features include:
For an in-depth analysis of features and price, visit our React spreadsheet components comparison.
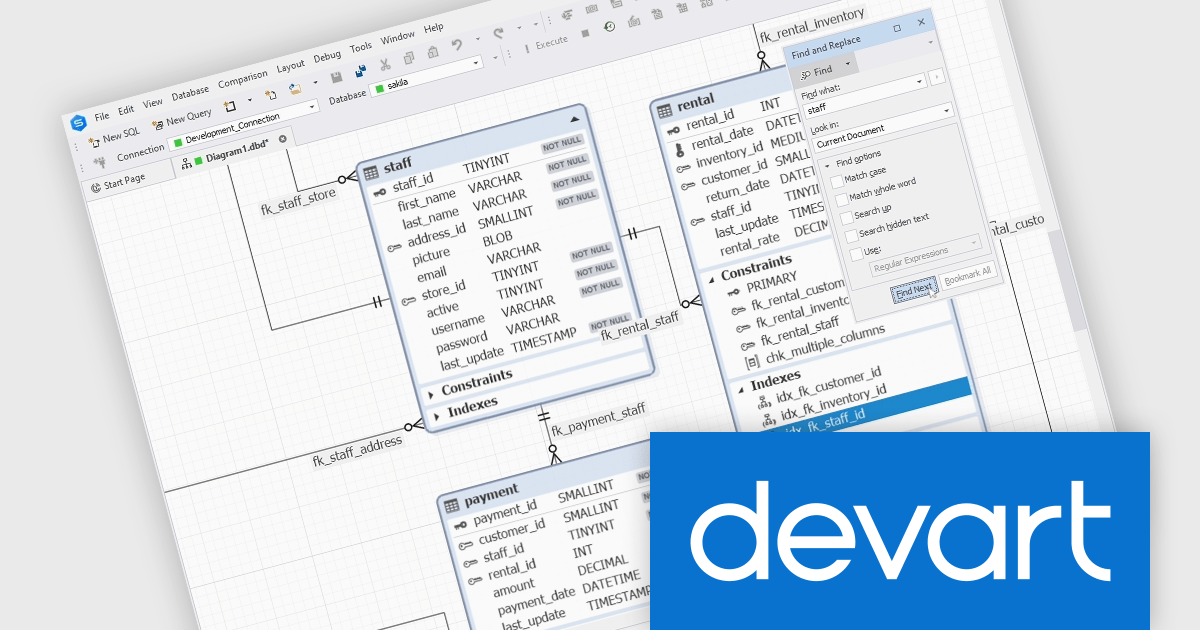
dbForge Edge is a unified database management solution designed for developers and database administrators working across multiple database systems. It combines tools for database development, administration, data analysis, and schema management into a single environment, supporting consistent workflows across platforms.
The latest dbForge Edge release adds a new object search on database diagrams. You can now locate objects and navigate to them directly on ER diagrams using the Find functionality. The search can also cover stamps, notes, relationships, and container names, which is particularly useful when dealing with large diagrams.
dbForge Edge is licensed per user and is available as an Annual or Perpetual License with a 12 month support and maintenance subscription. See our dbForge Edge licensing page for full details.
dbForge Edge bundle includes the following products:
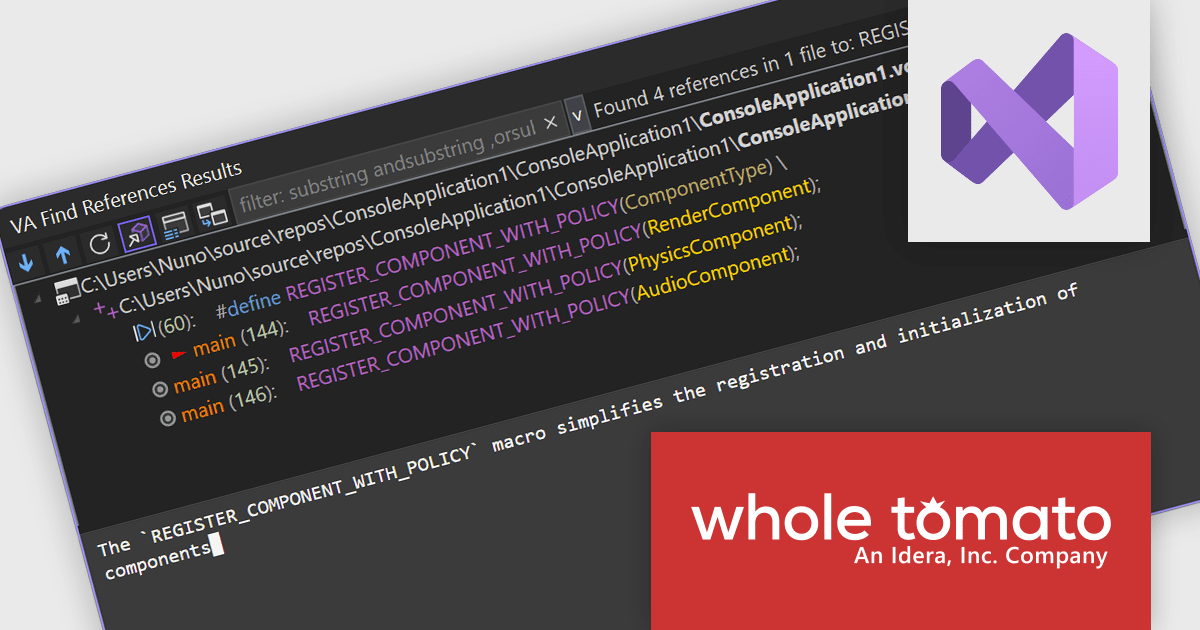
Visual Assist by Whole Tomato Software is a productivity plugin for Microsoft Visual Studio that enhances your C/C++ and C# development. It improves upon IntelliSense and syntax highlighting, improving code navigation and refactoring, and offers intelligent code completion and generation. Additionally, Visual Assist provides static code analysis to identify potential bugs and performance issues, all designed to save you time and effort while writing, reading, and maintaining your code.
The Visual Assist 2026.1 update enhances the responsiveness of VA Intelligence by improving AI-generated responses in real time, allowing developers to begin reading explanations as soon as generation starts rather than waiting for a complete result. This approach reduces perceived latency, which is especially noticeable when requesting detailed code explanations or working with larger codebases. By presenting information progressively, the update makes longer responses easier to consume and understand, supporting quicker comprehension and decision-making during development tasks. All processing continues to run locally on compatible GPU hardware, preserving Visual Assist’s commitment to keeping source code private and ensuring that no intellectual property leaves the developer’s machine.
To see a full list of what's new in 2026.1, see our release notes.
Visual Assist is licensed on a per-developer basis and offers three licensing options: Standard, Network Named User, and Concurrent. All new licenses include a 1 Year Maintenance Subscription, and Subscription Renewals are also available. See our Visual Assist licensing page for full details.
Learn more on our Visual Assist product page.
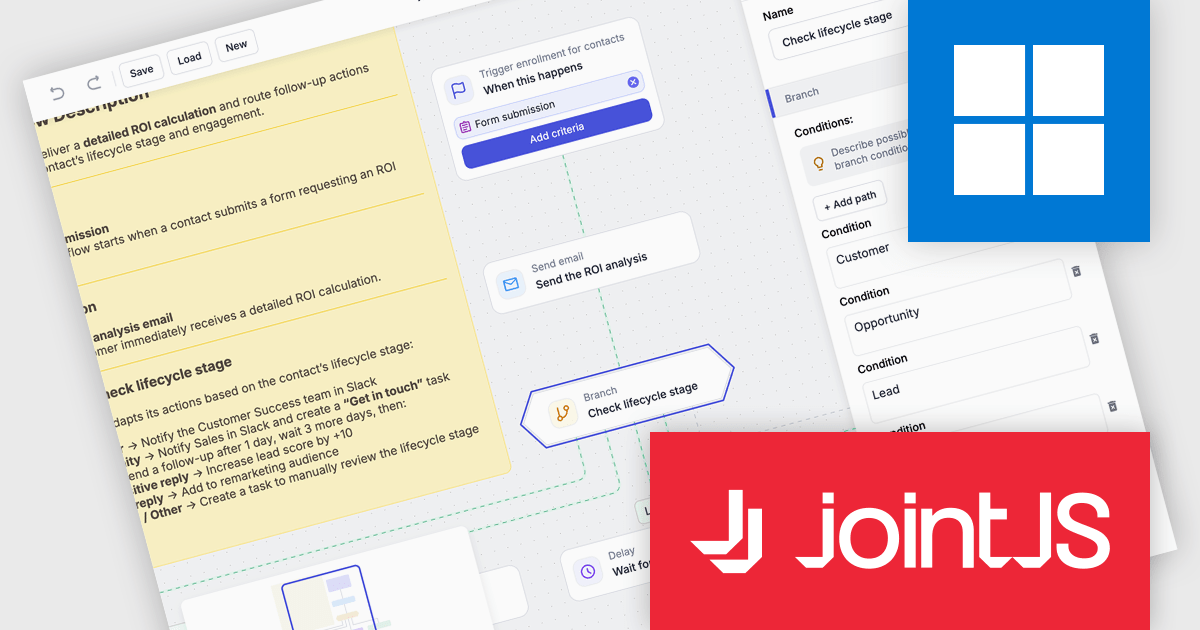
JointJS+ is a diagramming library that offers advanced features like custom shapes, data binding, and advanced layout algorithms, enabling you to create complex, interactive, and visually appealing diagrams. It includes a ready-to-use demo application that showcases its functionality and serves as a starting point for your own diagramming projects.
The JointJS+ v4.2.2 update introduces a new Marketing Automation application template that enables developers to efficiently design, visualize, and manage marketing automation workflows through an interactive, fully animated diagram with automatic layout and orthogonal link routing. By eliminating the need for manual positioning and providing smooth transitions between states, the template improves diagram clarity and maintainability while allowing developers to simulate workflows using the built-in test flow functionality to validate logic, identify issues early, and iterate with greater confidence.
To see a full list of what's new in v4.2.2, see our release notes.
JointJS+ is licensed per developer and is available as a Perpetual license with 1 year support and maintenance. See our JointJS+ licensing page for full details.
Learn more on our JointJS+ product page.
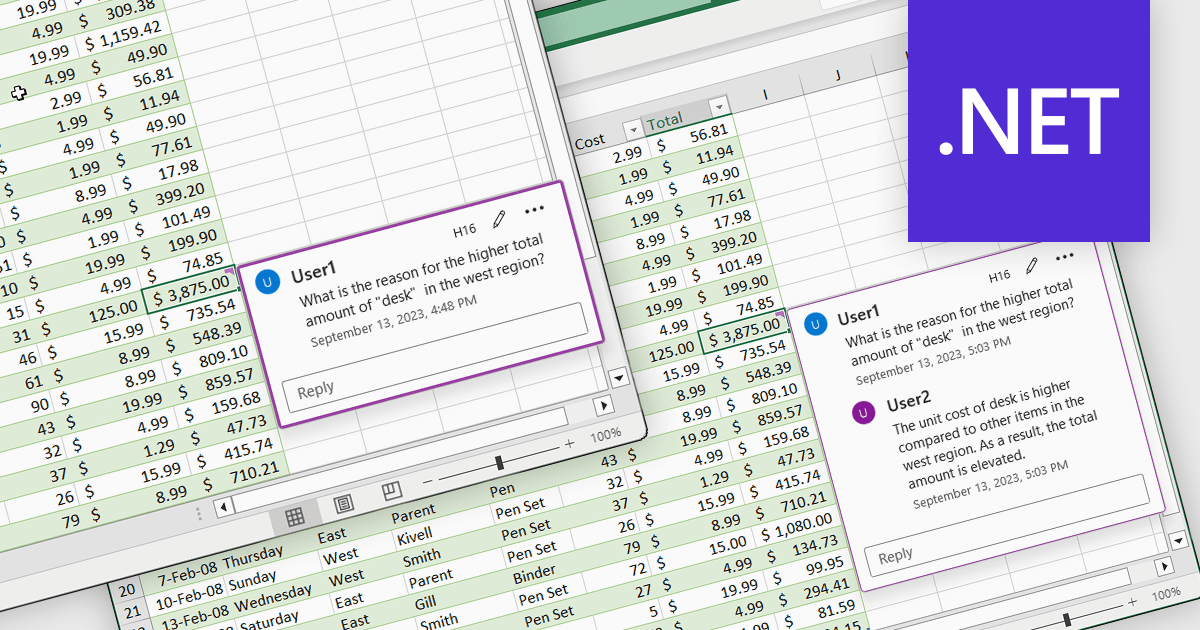
Cell comments and tooltips in spreadsheets allow users to attach contextual information to individual cells, displayed on hover or focus without altering the sheet’s layout. They help clarify data, explain formulas and assumptions, and provide guidance for correct data entry, reducing errors and misinterpretation. By keeping explanations close to the data, comments and tooltips improve collaboration, preserve knowledge, and make complex spreadsheets easier to understand and maintain. Common use cases include documenting calculation logic, adding validation instructions, leaving reviewer feedback, explaining exceptions in reports, and supporting onboarding for new users working with shared spreadsheets.
Several .NET Spreadsheet controls offer cell comments/tooltips including:
For an in-depth analysis of features and price, visit our .NET Spreadsheet controls comparison.
電話: (888) 850 9911
Fax: +1 770 250 6199


