


公式サプライヤー
公式および認定ディストリビューターとして200社以上の開発元から正規ライセンスを直接ご提供いたします。
当社のすべてのブランドをご覧ください。
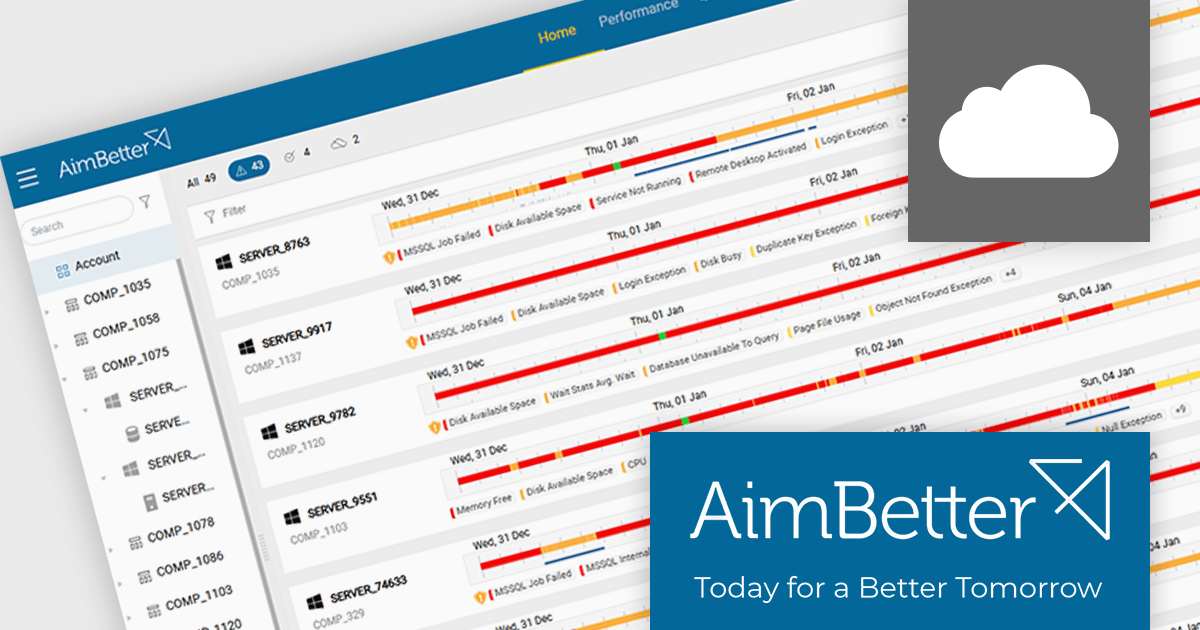
AimBetter is a comprehensive performance monitoring and optimization platform designed for database management systems (DBMS). It provides real-time diagnostics and analytics, allowing IT professionals to identify and resolve performance issues quickly and efficiently. By offering detailed insights into database operations, AimBetter enhances system stability, boosts performance, and reduces downtime. The platform supports various database environments and integrates with existing infrastructure, ensuring continuous monitoring and proactive management. Its user-friendly interface and advanced alerting mechanisms enable prompt action on critical issues, thereby optimizing resource utilization and improving overall operational efficiency.
The AimBetter January 2026 update expands its alert analysis capabilities to support historical views of up to one month, giving users immediate access to a broader context. Where previous alert views were limited to the last hour or required a step-by-step hourly review, the updated interface now displays all alerts for any selected period in one comprehensive display. This makes it much easier for teams to identify long-term trends, correlate recurring problems, and carry out deeper troubleshooting without jumping between views.
To see a full list of what's new in the January 2026 update, see our release notes.
AimBetter is licensed per instance/per year with different plans available dependent on the services you require. See our AimBetter licensing page for full details.
Learn more on our AimBetter product page.
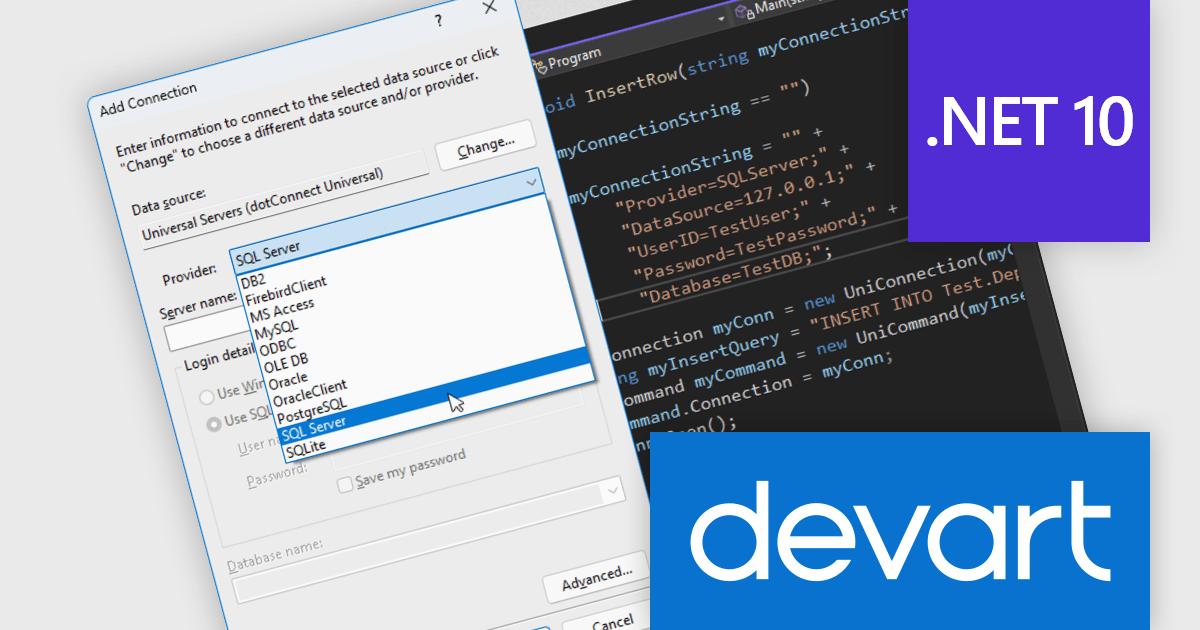
Devart dotConnect is a range of high-performance ADO.NET data providers for various databases and cloud applications, enabling efficient data connectivity for building web and mobile applications. It provides high-performance connectors for databases such as SQL Server and Oracle, as well as Cloud services such as Salesforce and QuickBooks Online.
The Devart dotConnect ADO.NET data providers now support .NET 10. By embracing the latest version of Microsoft's popular framework, developers gain access to the most up-to-date language features, performance enhancements, and improved tooling provided by .NET 10.
The dotConnect ADO.NET Data Providers are licensed per developer and are available as a Perpetual License with a 12 month support and maintenance subscription. See our dotConnect licensing pages for Adobe Commerce, BigCommerce, DB2, Dynamics 365, FreshBooks, Mailchimp, MySQL, Oracle, PostgreSQL, QuickBooks Online, Salesforce, Salesforce Marketing Cloud, SQL Server, SQLite, SugarCRM, Zoho Books, Zoho CRM, Zoho Desk, and Universal.
Devart dotConnect ADO.NET data providers are available for the following databases and Cloud services:
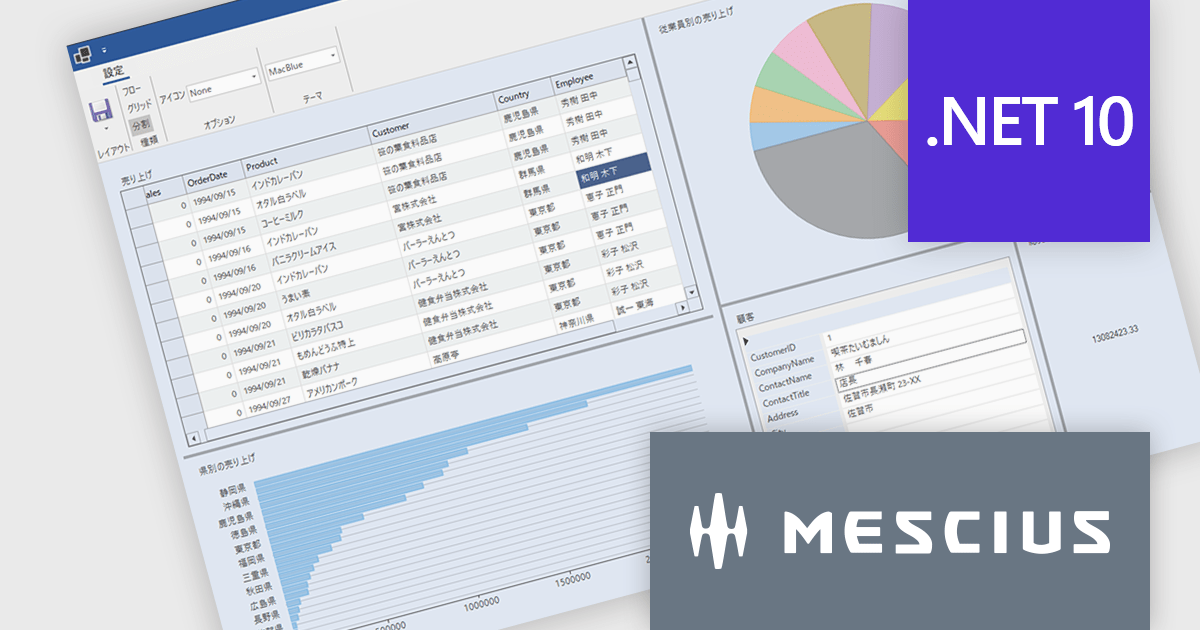
ComponentOneはデスクトップ、Web、モバイルに対応した.NETアプリケーションの開発を可能にします。小規模な社内システムから大規模エンタープライズシステムまで、業務システムのあらゆるニーズに柔軟に対応し開発生産性を大幅に向上させます。
最新バージョンComponentOne 2025J v2では、6つの主要エディション(WinForms/WPF/WinUI/ASP.NET Core/Blazor/.NET MAUI)全てで.NET 10対応コンポーネントを提供しています。これにより.NET 10のパフォーマンス向上メリットを活かしたアプリケーション開発が可能となります。また、統合開発環境の最新バージョンであるVisual Studio 2026にも正式に対応し、プロジェクトテンプレートやツールボックスの利用をスムーズに行えるようになりました。この対応により、.NETアプリケーション開発者は最新の技術基盤を活用しながら、堅牢で高速な業務アプリケーションを構築できます。ComponentOneはデスクトップ、Web、モバイル向けの豊富なUIコンポーネントを揃えており、それぞれのプラットフォームで統一された開発体験を提供します。
2025J v2での新機能一覧は、リリースノートを参考ください。
ComponentOneのライセンスは、開発者ごとに付与されるユーザーライセンスで、対象開発者は最大3台のマシンにインストール可能でで、ランタイムライセンスフリーです。なお、サブスクリプション契約期間中の無償バージョンアップや日本語によるE-mail技術サポートを無制限に受けることができます。詳細は、ComponentOneのライセンスページ をご参考ください。
ComponentOneの各エディション製品詳細及び販売情報は、以下のページをご参考ください。

PDF reading and writing features form a core part of modern PDF components, allowing applications to view, generate, edit, and share PDF documents consistently across platforms. These capabilities cover common tasks such as displaying and searching documents, as well as creating and exporting PDFs programmatically with reliable rendering and standards compliance.
Common features include:
For an in-depth analysis of features and price, visit our WinForms PDF components comparison.
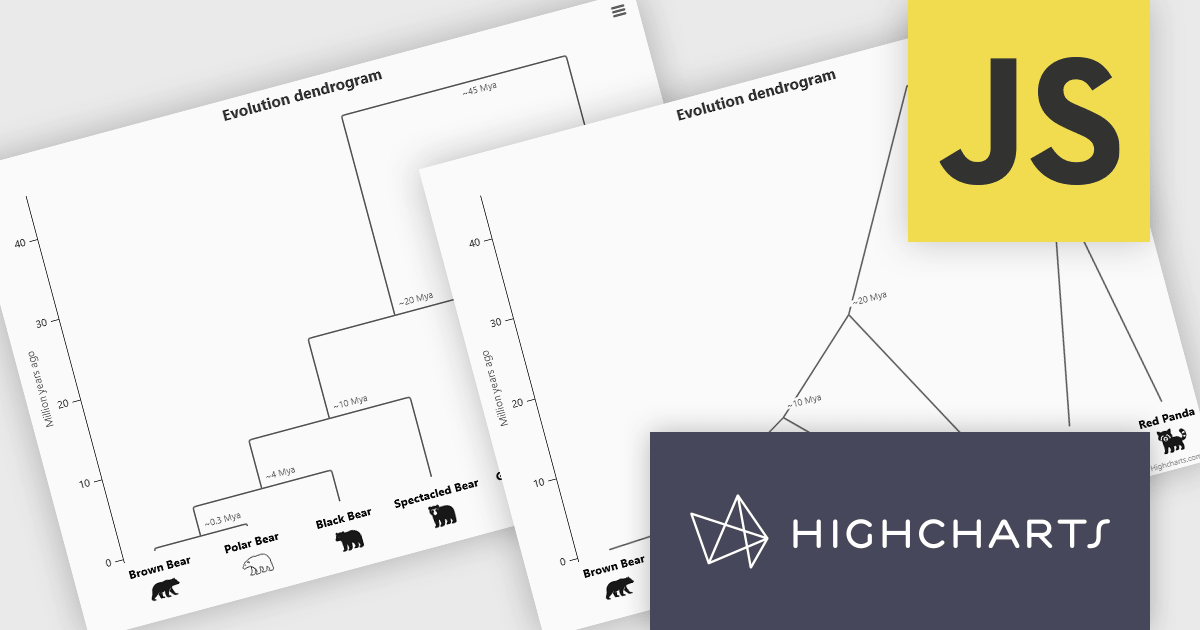
Highcharts is a JavaScript charting framework that allows web developers and data analysts to generate dynamic, visually appealing charts and graphs for websites and web applications. It can display a variety of chart types, including line, spline, area, column, bar, pie, scatter, and many more. Highcharts is well-known for its ease of use, rich documentation, and ability to handle huge datasets efficiently. Features include responsive design, accessibility support, and cross-browser compatibility. Its customization capabilities allow users to create bespoke data visualizations that increase engagement and provide insightful data presentations.
The Highcharts 12.5 update introduces dendrogram support, allowing developers to visualize hierarchical relationships and similarity levels directly within their charts using treegraph-based diagrams. This enhancement makes it easier to represent the output of hierarchical clustering algorithms, taxonomies, and other structured datasets in a clear and interpretable way. By mapping similarity or progression along an axis and using branch height to indicate relationships, developers can present complex hierarchical data more effectively.
To see a full list of what's new in 12.5, see our release notes.
Highcharts Core is licensed on an annual or perpetual basis, OEM licenses, and Advantage Renewals. It is licensed per Developer and has several license options including Internal, SaaS, SaaS+, and Self Hosted. See our Highcharts Core licensing page for full details.
Learn more on our Highcharts Core product page.
電話: (888) 850 9911
Fax: +1 770 250 6199


