公式サプライヤー
公式および認定ディストリビューターとして200社以上の開発元から正規ライセンスを直接ご提供いたします。
当社のすべてのブランドをご覧ください。
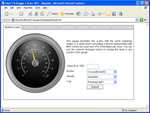
スクリーンショット: These gauges are normally used to represent a quantifiable process progressing through the possible range displayed on a scale with a circular or semi circular aspect. ...
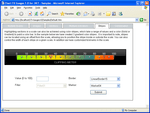
スクリーンショット: These gauges are normally used to represent the progress of a process or a specific value within a continuous range. There are various border styles available for customizing the gauges for your application needs. Vertical Gauges are similar to Horizontal ...
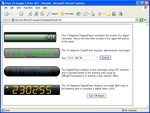
スクリーンショット: Digital panels are used for both numeric and alphanumeric displays. These panels are commonly prevalent in the world such as watches, registrars, information kiosks, alarm clocks, etc. There are three common styles of digital panels, two segment based and ...
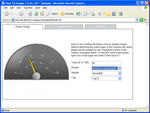
スクリーンショット: You can use the AJAX technique to update images without refreshing the entire page. For example a user could type text in an entry box and this could be displayed as a "Ticker" using a horizontal gauge or they could select a value from a drop ...
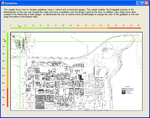
スクリーンショット: You can simulate guidlines by using vertical and horizontal gauges. In the above example the Draggable property of the MainIndicator allows users to change the value and move a guideline over the picture. ...
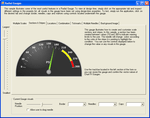
スクリーンショット: Scales: Each radial gauge may be accompanied by one or more scales to display a range of values and labels. Stripes: Each scale can have one or more stripes allowing you to highlight a specific range of values within the scale. In the example above yellow ...
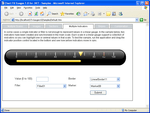
スクリーンショット: Each scale can be accompanied with a marker or filler to highlight a specific value in the scale. ...
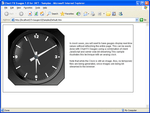
スクリーンショット: Real time data values can be displayed using a combination of client JavaScript and server side bit-streaming. In the example above the systems time is being used. ...
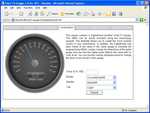
スクリーンショット: There are various ways to intermix the gauges together via the InnerGauge property for customizing the gauge. Examples of inner gauges include a radial speedometer with a digital panel on the lower portion for displaying the miles driven while the radial ...
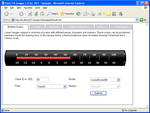
スクリーンショット: Gauges can display tick marks to reference values in the scale. Tick marks improve the readability and can be displayed as Major, Medium and Minor ticks in the scale. ...
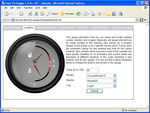
スクリーンショット: The above screenshot shows how it is possible to setup and locate multiple scales, needles and images. Any gauge element can be easily located in the drawing area based on a location relative to the border or to a specific Anchor point. ...
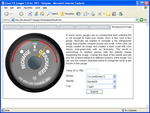
スクリーンショット: Create complex gauges by incorporating images, scales, colored stripes and any other gauge element. The above combination allows the creation of a realistic fire extinguisher gauge. ...
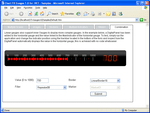
スクリーンショット: In this example a horizontal gauge has been combined with a DigitalPanel. The DigitalPanel will display the value of the horizontal gauge automatically without any code having to be written. ...