公式サプライヤー
公式および認定ディストリビューターとして200社以上の開発元から正規ライセンスを直接ご提供いたします。
当社のすべてのブランドをご覧ください。
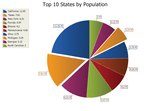
スクリーンショット: A pie chart displays a series of data as "slices" of a "pie". The data in the pie chart will be divided up into slices, each represents a percentage of the pie. The size of the slice will be proportional to the data it represents and ...
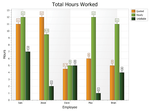
スクリーンショット: A bar chart displays data with rectangular "bars" with lengths relative to the data they symbolize. Generally a bar chart is used to display discontinuous data (data that has a discrete value), however it can also be used for continuous data. ...
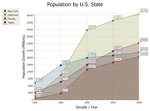
スクリーンショット: An area chart is very similar to a line chart. Data is displayed using different colors in the "area" below the line. Each series of points is represented with a different color. Area charts are commonly used to display accumulated values over a ...
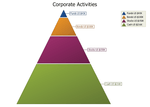
スクリーンショット: The Pyramid chart displays a series of data in a pyramid shape. The size of the pyramid sections are all relative to each other and the order does not matter. You can have a "top heavy" pyramid where the largest section is the top section or any ...
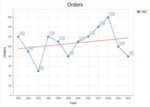
スクリーンショット: A Trend Line shows the the general direction that a set of data seem to be heading over a period of time. ...