公式サプライヤー
公式および認定ディストリビューターとして200社以上の開発元から正規ライセンスを直接ご提供いたします。
当社のすべてのブランドをご覧ください。
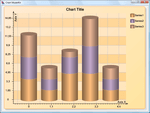
スクリーンショット: The Chart ModelKit supports the most popular Series types: Bar, Line, Pie, Stock, and many others. The Chart ModelKit concept provides separation of data storing and displaying, i.e. it provides the ability to change series type without changing series ...
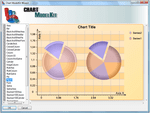
スクリーンショット: Double click on the ChartViewer component to run the Designer. When you open the designer the Wizard window also opens. Here you can select a chart from a number of existing templates. Select the chart from the list, click the OK button and the selected ...
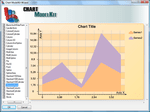
スクリーンショット: The AreaSeriesView represents data as area, bounded by a broken line, passing through all series points. The StackedAreaSeriesView is a chart, containing areas corresponding to different series. Series are located one over another. The ...
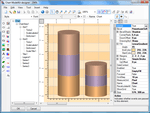
スクリーンショット: The Chart ModelKit Designer is used for creating charts. Chart is an object, containing various elements. Every element has a set of properties which are displayed in the Properties Window. You can edit properties in this window. Visual and non-visual ...
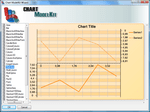
スクリーンショット: Axis is a scale, in which chart values are displayed. The scale range is assigned by the MinValue and MaxValue properties which can be set manually or can be automatically calculated based on the scale range of the series point’s values and setting the ...
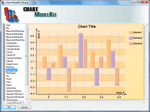
スクリーンショット: This screenshot demonstrates the creation of the MultiColumn chart. ...