公式サプライヤー
公式および認定ディストリビューターとして200社以上の開発元から正規ライセンスを直接ご提供いたします。
当社のすべてのブランドをご覧ください。
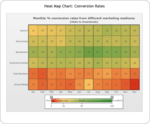
スクリーンショット: The Heat Map charts represents data in a tabular format with user-defined color ranges like low, average and high. It is used to plot complex data like performance comparison of different companies, periodic table, employee attendance, stock market ...
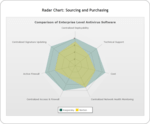
スクリーンショット: The Radar chart is a very effective tool for comparing multiple entities based on different characteristics. For instance, they can be used for comparing various cars based on their fuel efficiency, maneuverability, pick-up and engine power. ...
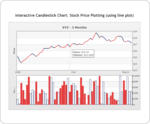
スクリーンショット: The candlestick chart offers you a powerful and interactive interface to plot your stock data. It offers the following features: Integrated price and volume plot. Volume plot can be turned on or off. Multiple options for price plotting- Candlestick / bar ...
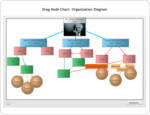
スクリーンショット: The drag-node chart is a specialized type of chart where each data set is shown on the chart as a drag-able node. Perfect for network diagrams, hierarchy structures etc. this chart provides a highly intuitive interface for your end users to visually ...
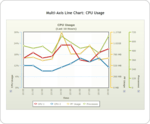
スクリーンショット: The multi-axis line chart from PowerCharts suite is an interactive line chart that allows for the following feaures: Multiple axis on the same chart. Interactive axis, that allow the end user to show/hide data-sets (lines) plotting against that axis. ...
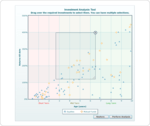
スクリーンショット: The Select Scatter chart is a special type of chart that allows users to visually select a subset of data from the given data points. Essentially, it's a extension of XY Plot Chart (Scatter Chart) from FusionCharts v3 with the added functionality of ...
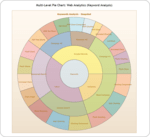
スクリーンショット: PowerCharts can be used for a variety of purposes like simulations, visual data selection, scientific plotting, financial analysis etc. ...
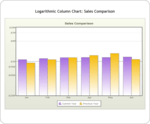
スクリーンショット: PowerCharts introduces logarithmic charts in the suite. The logarithmic column and line charts are very similar to the normal charts, but for the fact that these charts use a logarithmic axis instead of a normal linear axis. Since these charts derive from ...
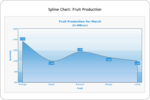
スクリーンショット: A spline chart is a chart that plots a fitted curve through every data point in a series. PowerCharts includes Spline Chart, Spline Area Chart, Multi-Series Spline Chart and Multi-Series Area Chart. ...
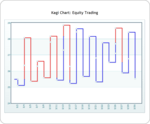
スクリーンショット: A type of chart developed by the Japanese in the 1870s that uses a series of vertical lines to illustrate general levels of supply and demand for certain assets. Thick lines are drawn when the price of the underlying asset breaks above the previous high ...