公式サプライヤー
公式および認定ディストリビューターとして200社以上の開発元から正規ライセンスを直接ご提供いたします。
当社のすべてのブランドをご覧ください。
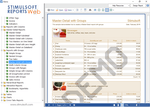
スクリーンショット: Includes a complex but simple report generator which includes a huge variety of components: charts, olap-cubes, tables etc. ...

スクリーンショット: Includes a complex but simple report generator which includes a huge variety of components: charts, olap-cubes, tables etc. ...
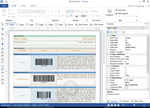
スクリーンショット: Three report designers for the.NET Framework platform: WinForms, WebForms and WPF. ...

スクリーンショット: Three report designers for the.NET Framework platform: WinForms, WebForms and WPF. ...
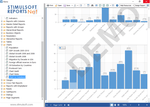
スクリーンショット: Stimulsoft Reports offers full set of graphic objects: images, charts, graphic primitives (the Shape component), barcodes, RTF text and CheckBox. ...

スクリーンショット: Stimulsoft Reports offers full set of graphic objects: images, charts, graphic primitives (the Shape component), barcodes, RTF text and CheckBox. ...
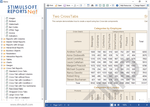
スクリーンショット: The Cross table is a special component that is used to process, group and summarize data from the data source. The result is represented as a table. The Cross table can be placed both directly on a page or on a Data band. If a table that is created as a ...

スクリーンショット: The Cross table is a special component that is used to process, group and summarize data from the data source. The result is represented as a table. The Cross table can be placed both directly on a page or on a Data band. If a table that is created as a ...
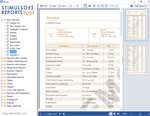
スクリーンショット: The Report Designers, which can be run in DesignTime and in RunTime, include a unique report designer for Web. ...

スクリーンショット: The Report Designers, which can be run in DesignTime and in RunTime, include a unique report designer for Web. ...