公式サプライヤー
公式および認定ディストリビューターとして200社以上の開発元から正規ライセンスを直接ご提供いたします。
当社のすべてのブランドをご覧ください。
リリースノート: New Slope Series- ISlopeSeries sorts and paints several lines into a single series. Vertical order of points is based on their ranking at each horizontal coordinate. New Squarified Map Series- ISquarifiedMapSeries displays hierarchical data as rectangles ...
リリースノート: Added the IAxis.SetAxisLinkx64 property. Fixed setting Axis for x64bits. 0 ...
リリースノート: Fix on installer. It wasn't possible to use control in VB6. 0 ...
リリースノート: Fixes related to the TeeChart202364.cab generation. inf file not being correctly used for 64bits version. 0 ...
リリースノート: Fixes in version Name and other minor changes. 0 ...
リリースノート: SeriesAnimation tool can now export to SVG. SeriesAnimation tool can now export to SVG. IExport interface now includes 'CopyToClipboardJPEG' and 'CopyToClipboardPNG'. Updates in 2023 1 ...

説明: Create high performance dashboards and charting solutions. TeeChart Pro ActiveX is a charting control for ActiveX aware programming environments such as Microsoft Office, Visual Studio's VB, VC++ and ASP, including Visual Studio.NET (VB.NET, C#). It ...

説明: 優れたパフォーマンスのダッシュボードとグラフ作成用コンポーネント TeeChart Pro ActiveX は Microsoft Office, Visual Studio.NET (VB.NET, C#)を含んだVisual Studio's VB, VC++ and ASPのような ActiveX に対応しているプログラミング環境のためにチャーティングコントロールです。チャーティングアーキテクチャと機能セットでTeeChart ActiveX が有効な直観的、そして ...
リリースノート: Adds new Polygon3DConcave canvas function. Added new Polygon3DConcave canvas function. Breaking change: Due to a new conflict with IMapPolygon.GetPoints method once a new Microsoft Visual Studio VC.NET project is created that uses the TeeChart ActiveX ...
リリースノート: Adds new Violin and HorizViolin series styles. Added new Violin and HorizViolin series styles. Added new BeeSwarm and HorizBeeSwarm series styles. Added new KDE function. Added new Lagrange function. ...
リリースノート: Bug 2071- Fixed so that you can now change the size through the editor and all is working fine on ActiveX. ...
リリースノート: Adds new ISeries properties; StartZ, MiddleZ and EndZ. Added new ISeries properties: StartZ MiddleZ EndZ Bug 2118- Fixed TChart1.Series(0).asPolarGrid.Palette.UsePalette = True. Bug 2180- ILegend.NumRows and ILegend.NumCols properties have been ...
カスタマーレビュー: wscho 4 Korea, Republic Of ...
リリースノート: Adds new ISeriesColorPalette interface to support PolarGrids. Added new ISeriesColorPalette interface to support PolarGrids. ...

スクリーンショット: 0 ...
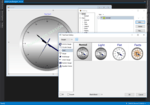
リリースノート: Adds new IClockGaugeSeries, plus bug fixes. Added new IClockGaugeSeries (scClockGauge) interface, and its properties and methods. IClockSeries (scClock) is deprecated. Fixed- TAxisScrollBarTool messes up axis bounds. Fixed- Exported data to xls doesn
リリースノート: Maintenance release fixes ocx registration problem. Fixed problem registering the ocx library that did not allow selecting components from the component list. Note: Please unregister TeeChart v2018.0.2.9 before installing v.2018.0.3.16. ...

スクリーンショット: Donut Chart draws points very similar to Pie Chart with a middle hole. The hole dimensions can be configured as percent of circle radius. 0 ...

スクリーンショット: Line plotting data values trend over time. 0 ...

スクリーンショット: Example of several Pie series within a Chart. 0 ...