公式サプライヤー
公式および認定ディストリビューターとして200社以上の開発元から正規ライセンスを直接ご提供いたします。
当社のすべてのブランドをご覧ください。

説明: Analytical tools for displaying financial/stock and other time-based data. amCharts 5: Stock Chart allows you to display any time-based data, complete with built-in annotations, indicators and comparison, as well as other features you’d expect from a full ...

説明: 財務/株式およびその他の時間ベースのデータを表示するための分析ツール amCharts 5: Stock Chart allows you to display any time-based data, complete with built-in annotations, indicators and comparison, as well as other features you’d expect from a full-fledged stock chart. amCharts 5: Stock ...

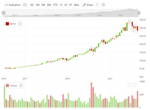
スクリーンショット: Panels can be added and removed dynamically. They can either be sized via API or by user. 0 ...

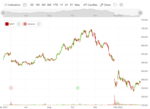
スクリーンショット: Automatic indicators include Bollinger bands, Moving average, and many more. 0 ...

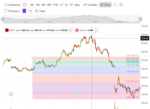
スクリーンショット: Annotation tools offer functionality from as simple as shapes and labels, to complex data analysis like Fibonacci. 0 ...