Embarcadero / Syncfusion / Infragistics / MindFusion Group / IDERA
Professional flowchart Java control enables customized diagrams and charts.
- Draw diagrams for workflow processes, object hierarchies & relationships, graphs & networks, organizational charts, XML documents and more
- Royalty free redistribution and source code is available
-
スクリーンショット:
0 ...
続きを読む
この製品についてさらに結果を表示します。
-
-
-
スクリーンショット:
FlowChartX Professional can automatically route arrows in the shortest way they reach from their source to their destination without crossing any diagram nodes. ...
続きを読む
この製品についてさらに結果を表示します。
-
スクリーンショット:
This traffic Diagram screenshot shows boxes containing metafile images. Boxes can be rotated interactively by dragging their round rotation handle. ...
続きを読む
-
スクリーンショット:
Box-Objects can hold images, text or both. The boxes shown in the screenshot display icons representing network nodes. Hierarchical grouping is shown too. ...
続きを読む
-
スクリーンショット:
This traffic Diagram screenshot shows boxes containing metafile images. Boxes can be rotated interactively by dragging their round rotation handle. ...
続きを読む
この製品についてさらに結果を表示します。
-
スクリーンショット:
Box-Objects can hold images, text or both. The boxes shown in the screenshot display icons representing network nodes. Hierarchical grouping is shown too. ...
続きを読む
-
スクリーンショット:
Use Decorated tables to display diagram entities. Tables have anchor points associated with each row, defining where incoming and outgoing connections dock to tables. ...
続きを読む
-
スクリーンショット:
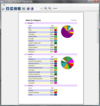
MindFusion Reporting includes advanced features like scroll/ zoom / print / reports preview or a a Build in Charting Component with Wizard. ...
続きを読む
この製品についてさらに結果を表示します。
-
スクリーンショット:
MindFusion's professional reporting tool features a complete list of properties, methods and events that let you create advanced business reports in the style and format you want them. ...
続きを読む
-
スクリーンショット:
A report Designer automates customizing the report's appearance. Placement of any WinForms control as a report element is also possible. ...
続きを読む
-
スクリーンショット:
Entity Developer
続きを読む
この製品についてさらに結果を表示します。
-
スクリーンショット:
Update Database Wizard ...
続きを読む
-
スクリーンショット:
Association Editor
続きを読む
-
スクリーンショット:
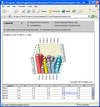
Demonstrates simple usage of chart connected to the JTable. ...
続きを読む
この製品についてさらに結果を表示します。
-
スクリーンショット:
Demonstrates the setting of color, transparency and other color properties in the chart layers. ...
続きを読む
-
スクリーンショット:
Demonstrates various properties of chart with animation. ...
続きを読む
-
スクリーンショット:
Screenshot of NetAdvantage Reporting
続きを読む
この製品についてさらに結果を表示します。
-
スクリーンショット:
Screenshot of NetAdvantage Reporting
続きを読む
-
スクリーンショット:
Screenshot of NetAdvantage Reporting
続きを読む
-
スクリーンショット:
Customize the appearance of Calendar in design-time property pages Specify display preferences such as orientation of objects inside the day cell,as well as fonts, colors and images for the day cell and header. ...
続きを読む
この製品についてさらに結果を表示します。
-
スクリーンショット:
Start Day Chooser Features of the DayView control are combined into an adjustable weekly display, with design-time or run-time selection of the start day. ...
続きを読む
-
スクリーンショット:
ScheduleX is apartment-model threaded for optimal use in Microsoft Internet Explorer. ...
続きを読む
-
スクリーンショット:
Dynamically create visually rich organization charts using built-in layout managers. ...
続きを読む
この製品についてさらに結果を表示します。
-
スクリーンショット:
Create highly interactive web and windows applications like flight seat reservation. ...
続きを読む
-
スクリーンショット:
Create Swim Lane like process flow diagrams to depict what or who is working on a particular subset of a process. ...
続きを読む
-
スクリーンショット:
Use the RadialTreeLayoutManager layout management class to create diagrams with a radial layout. ...
続きを読む
この製品についてさらに結果を表示します。
-
スクリーンショット:
Diagram interactivity is achieved using a combination of client-side image maps, client-side JavaScript, and server-side events raised by the DiagramWebControl. ...
続きを読む
-
スクリーンショット:
Various events available on the server side are also supported on the client side for manipulation. ...
続きを読む


