Vizuly / Raynet / JSCharting / Atalasoft - ベストセラー商品

  1. $$$$$ | 購入

    説明: Enterprise Software Packaging. RayPack Studio includes powerful software solutions with a large number of features that automate and accelerate holistic packaging projects. RayPack Studio provides a set of software products and components for professional ... 続きを読む

  2. $$$ | 購入

    説明: Stunning JavaScript charts and Data Visualizations for your website and web applications. JSCharting is a JavaScript chart data visualization library which includes over 150 advanced chart types plus interactive JavaScript stock charts, seamless JS grid, ... 続きを読む

  3. $$$$$ | 購入

    説明: Application Lifecycle Management Workflow. RayFlow is a workflow management solution that collects and provides required information via tasks and phases, tailored to project needs of any complexity level. It operates as a joining link between teams and ... 続きを読む

  4. $ | 購入

    説明: Smarter software and hardware inventory. RayVentory provides a comprehensive inventory of your hardware and software and offers a variety of scanning methods to collect the best quality data from increasingly complex IT landscapes. The integration of ... 続きを読む

  5. $ | 購入

    説明: A New Generation of Software Deployment. RayManageSofti is a comprehensive and automated suite to provide deployment and management functionality in the context of Enterprise Application Lifecycle Management. It offers operating system (OS) and software ... 続きを読む

  6. $ | 購入

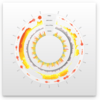
    説明: A radial line and area layout visualization. Vizuly Corona is a radial chart that provides angular and curved radial area line curves and supports both an overlap and stacked layout. It also features over a dozen different dynamic styles and comes bundled ... 続きを読む

  7. $ | 購入

    説明: Represent transactional relationships from a specified number of sources to a variable number of targets. Vizuly Halo uses several different data visualization techniques to represent transactional relationships from a specified number of sources to a ... 続きを読む

  8. $ | 購入

    説明: Represent cartesian x/y data within a radial plot. Vizuly Radial Bar is designed to represent cartesian x/y data within a radial plot. It supports both clustered and stacked radial bars Use the interactive style explorer on the left to view different ... 続きを読む

  9. $ | 購入

    説明: Easily display multi-variate time series information. Vizuly Ring Chart lets you easily display multi-variate time series information. Due to its radial form factor, you can display 3 times the information for a given screen width than you could with a ... 続きを読む

  10. $ | 購入

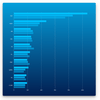
    説明: Add stacked and clustered bar charts to your JavaScript apps. Vizuly Bar Chart supports both stacked and clustered layout options, as well as over 2 dozen different dynamic styles. It also comes bundled with a test container and examples of different ... 続きを読む