コンポーネント / Vizuly / Clever Components / ImagesInfo / WebCab - ベストセラー商品
Create highly customized and unique data visualizations.
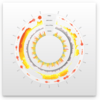
Corona Chart - This radial chart provides angular and curved radial area line curves and supports both an overlap and stacked layout. It also features over a dozen different dynamic styles and comes bundled with an easy to use test container that demonstrates seven uniquely styled themes.
-
説明:
Add instant SSL/TLS security to your Internet applications and implement many useful Internet related features. Clever Internet Suite lets you add downloading, uploading and submitting of Internet-resources; sending and receiving of MIME messages; HTTP, ...
続きを読む
この製品についてさらに結果を表示します。
-
説明:
インターネットアプリケーションにSSL/TLSによるセキュリティを追加、便利な機能を多数実装 インターネットアプリケーションにSSL / TLSセキュリティをすぐに追加でき、多くの有用なインターネット関連の機能を実装しています。Clever Internet Suiteは、ダウンロード、アップロードおよびインターネットリソースの送信、MIMEメッセージの送受信、HTTP, FTP, SMTP, POP3, IMAP 及び NNTPクライアント/サーバーソリューション ...
続きを読む
-
説明:
Compare and synchronize SQL database objects and table records. Database Comparer VCL compares and synchronizes database structure (metadata) and table data for many popular databases. The list of supported databases is constantly updated and includes ...
続きを読む
この製品についてさらに結果を表示します。
-
説明:
SQLデータベースのオブジェクトとテーブルのレコードを比較、同期 SQLデータベース·オブジェクトとテーブルのレコードを比較して同期できます。Database Comparer VCLは、データベース構造の比較、同期、更新ができます。互いのデータベースやSQL / DDLスクリプトを使用してデータベースを比較することができます。データベース間のすべての相違を表示し、すべてまたは選択の相違を解消するために自動的に生成されたスクリプトを実行することができます。ライブラリには ...
続きを読む
-
説明:
Add instant SSL/TLS security to your Internet applications and implement many useful Internet related features. Clever Internet.NET Suite lets you add downloading, uploading and submitting of Internet-resources; sending and receiving of MIME messages; ...
続きを読む
この製品についてさらに結果を表示します。
-
説明:
インターネットアプリケーションにSSL/TLSによるセキュリティを追加、便利な機能を多数実装 Clever Internet.NET Suite は.net アプリケーションに電子認証をサポートした、インターネット- リソースのダウンロード、アップロード、送信機能の追加、 MIME メッセージ; HTTP, FTP, SMTP, POP3, IMAPとNNTPクライアント/サーバーソリューション; SSL/TLS チャンネルでの送受信ができます。Clever Internet.NET Suite ...
続きを読む
-
説明:
A radial line and area layout visualization. Vizuly Corona is a radial chart that provides angular and curved radial area line curves and supports both an overlap and stacked layout. It also features over a dozen different dynamic styles and comes bundled ...
続きを読む
この製品についてさらに結果を表示します。
-
説明:
放射状の折れ線グラフと面グラフ Vizuly Corona is a radial chart that provides angular and curved radial area line curves and supports both an overlap and stacked layout. It also features over a dozen different dynamic styles and comes bundled with an easy to use test ...
続きを読む
-
説明:
Represent asymmetric hierarchical information in an easy to read visualization. Vizuly Weighted Tree nodes and branches can be dynamically sized and styled based on data bound properties that you set. One challenge with large hierarchal tree structures is ...
続きを読む
この製品についてさらに結果を表示します。
-
説明:
階層構造のデータを非対称のツリーで分かりやすく表示 Vizuly Weighted Tree nodes and branches can be dynamically sized and styled based on data bound properties that you set. One challenge with large hierarchal tree structures is being able to easily navigate the tree when many ...
続きを読む
-
説明:
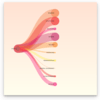
Represent transactional relationships from a specified number of sources to a variable number of targets. Vizuly Halo uses several different data visualization techniques to represent transactional relationships from a specified number of sources to a ...
続きを読む
この製品についてさらに結果を表示します。
-
説明:
指定された数のソースから可変数のターゲットへの推移を表現 Vizuly Halo uses several different data visualization techniques to represent transactional relationships from a specified number of sources to a variable number of targets. Sources are represented as segmented arcs along the ...
続きを読む
-
説明:
Represent cartesian x/y data within a radial plot. Vizuly Radial Bar is designed to represent cartesian x/y data within a radial plot. It supports both clustered and stacked radial bars Use the interactive style explorer on the left to view different ...
続きを読む
この製品についてさらに結果を表示します。
-
説明:
直交座標のxとyのデータを放射状にプロット Vizuly Radial Bar is designed to represent cartesian x/y data within a radial plot. It supports both clustered and stacked radial bars Use the interactive style explorer on the left to view different style settings, themes, and other ...
続きを読む
-
説明:
Easily display multi-variate time series information. Vizuly Ring Chart lets you easily display multi-variate time series information. Due to its radial form factor, you can display 3 times the information for a given screen width than you could with a ...
続きを読む
この製品についてさらに結果を表示します。
-
説明:
異なる複数の時系列のデータを簡単に表示 Vizuly Ring Chart lets you easily display multi-variate time series information. Due to its radial form factor, you can display 3 times the information for a given screen width than you could with a more traditional cartesian layout. ...
続きを読む
-
説明:
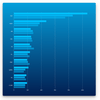
Add stacked and clustered bar charts to your JavaScript apps. Vizuly Bar Chart supports both stacked and clustered layout options, as well as over 2 dozen different dynamic styles. It also comes bundled with a test container and examples of different ...
続きを読む
この製品についてさらに結果を表示します。
-
説明:
JavaScriptアプリに積み上げ横棒グラフとグループ化横棒グラフを追加 Vizuly Bar Chart supports both stacked and clustered layout options, as well as over 2 dozen different dynamic styles. It also comes bundled with a test container and examples of different style based themes. You can ...
続きを読む
-
説明:
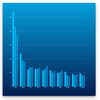
Add stacked and clustered column charts to your JavaScript apps. Vizuly Column Chart supports both stacked and clustered layout options, as well as over 2 dozen different dynamic styles. It also comes bundled with a test container and examples of ...
続きを読む
この製品についてさらに結果を表示します。
-
説明:
JavaScriptアプリに積み上げ縦棒グラフとグループ化縦棒グラフを追加 Vizuly Column Chart supports both stacked and clustered layout options, as well as over 2 dozen different dynamic styles. It also comes bundled with a test container and examples of different style based themes. You ...
続きを読む


