PDF Xpress .NET(英語版)
真のPDFレンダリングソリューションを搭載したアプリケーションをすばやく簡単に作成。
セキュリティ設定を追加 - 権限、暗号化方式、パスワードなど、文書のセキュリティ設定にアクセスできます。 セキュリティ保護された文書のセキュリティ設定を編集、削除することも、セキュリティ保護されていない文書にセキュリティ設定を追加することもできます。.

説明: Barcode SDK for 1D and 2D barcodes. Barcode Xpress Java is a powerful control which accurately reads common industry 1D and 2D barcodes, detecting them anywhere on the page, in any orientation. It is for high-end, high-volume imaging applications where ... 続きを読む この製品についてさらに結果を表示します。
説明: 1次元と2次元バーコードのSDK Barcode Xpress Java is a powerful control which accurately reads common industry 1D and 2D barcodes, detecting them anywhere on the page, in any orientation. It is for high-end, high-volume imaging applications where speed is critical for ... 続きを読む

説明: Detect, read and write more than 30 types of 1D or 2D barcodes. Barcode Xpress supports 1D codes like Code 39 and 128, UPC, EAN, and 4-state postal codes, plus 2D barcodes including DataMatrix, QR Code, PDF417, Aztec, and more. It is designed for ... 続きを読む この製品についてさらに結果を表示します。
説明: 30種類を超える1次元と2次元のバーコードを認識、読み取り、書き込み Barcode Xpress は1ページごとにバーコードを見つけて中身を解読し、認識信頼性の高いレポートを戻します。Barcode Xpress は、インデックス作成とアーカイブ作成に理想的な、ハイスピードバーコード読取り、書込みを提供します。 Barcode Xpress Primary Features Detect, read, and write 1D and 2D barcodes. Recognize barcodes ... 続きを読む

説明: Detect, read and write more than 30 types of 1D or 2D barcodes. Barcode Xpress.NET Core edition supports 1D codes like Code 39 and 128, UPC, EAN, and 4-state postal codes, plus 2D barcodes including DataMatrix, QR Code, PDF417, Aztec, and more. It is ... 続きを読む この製品についてさらに結果を表示します。
説明: 30種類を超える1次元と2次元のバーコードを認識、読み取り、書き込み Barcode Xpress.NET Core edition supports 1D codes like Code 39 and 128, UPC, EAN, and 4-state postal codes, plus 2D barcodes including DataMatrix, QR Code, PDF417, Aztec, and more. It is designed for professional, high ... 続きを読む

説明: Scanned image cleanup SDK. ScanFix Xpress.NET improves image quality and increases content recognition accuracy by applying image processing and enhancements to color, grayscale, and black and white images. ScanFix Xpress provides brightness/contrast ... 続きを読む この製品についてさらに結果を表示します。
説明: スキャン画像のクリーンアップSDK ScanFix Xpress.NETは画像品質を改善し、イメージ処理との拡張を、カラー、グレースケール、白黒画像に適用することで、コンテンツ認識正確さを増やします。ScanFix Xpress は輝度 / コントラスト訂正、ノイズが多いカラーのクリーンアップ、カラー検出、カラードロップアウトあるいはカラー抽出、追加の画像クリーンアップ特性を提供します。ラインとドット陰影を取り去って、キャラクタをスムーズにし、修復、不必要なボーダーを排除できます。AutoBinarize ... 続きを読む

説明: A radial line and area layout visualization. Vizuly Corona is a radial chart that provides angular and curved radial area line curves and supports both an overlap and stacked layout. It also features over a dozen different dynamic styles and comes bundled ... 続きを読む この製品についてさらに結果を表示します。
説明: 放射状の折れ線グラフと面グラフ Vizuly Corona is a radial chart that provides angular and curved radial area line curves and supports both an overlap and stacked layout. It also features over a dozen different dynamic styles and comes bundled with an easy to use test ... 続きを読む

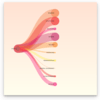
説明: Represent asymmetric hierarchical information in an easy to read visualization. Vizuly Weighted Tree nodes and branches can be dynamically sized and styled based on data bound properties that you set. One challenge with large hierarchal tree structures is ... 続きを読む この製品についてさらに結果を表示します。
説明: 階層構造のデータを非対称のツリーで分かりやすく表示 Vizuly Weighted Tree nodes and branches can be dynamically sized and styled based on data bound properties that you set. One challenge with large hierarchal tree structures is being able to easily navigate the tree when many ... 続きを読む

説明: Represent transactional relationships from a specified number of sources to a variable number of targets. Vizuly Halo uses several different data visualization techniques to represent transactional relationships from a specified number of sources to a ... 続きを読む この製品についてさらに結果を表示します。
説明: 指定された数のソースから可変数のターゲットへの推移を表現 Vizuly Halo uses several different data visualization techniques to represent transactional relationships from a specified number of sources to a variable number of targets. Sources are represented as segmented arcs along the ... 続きを読む

説明: Represent cartesian x/y data within a radial plot. Vizuly Radial Bar is designed to represent cartesian x/y data within a radial plot. It supports both clustered and stacked radial bars Use the interactive style explorer on the left to view different ... 続きを読む この製品についてさらに結果を表示します。
説明: 直交座標のxとyのデータを放射状にプロット Vizuly Radial Bar is designed to represent cartesian x/y data within a radial plot. It supports both clustered and stacked radial bars Use the interactive style explorer on the left to view different style settings, themes, and other ... 続きを読む

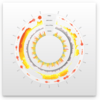
説明: Easily display multi-variate time series information. Vizuly Ring Chart lets you easily display multi-variate time series information. Due to its radial form factor, you can display 3 times the information for a given screen width than you could with a ... 続きを読む この製品についてさらに結果を表示します。
説明: 異なる複数の時系列のデータを簡単に表示 Vizuly Ring Chart lets you easily display multi-variate time series information. Due to its radial form factor, you can display 3 times the information for a given screen width than you could with a more traditional cartesian layout. ... 続きを読む

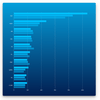
説明: Add stacked and clustered bar charts to your JavaScript apps. Vizuly Bar Chart supports both stacked and clustered layout options, as well as over 2 dozen different dynamic styles. It also comes bundled with a test container and examples of different ... 続きを読む この製品についてさらに結果を表示します。
説明: JavaScriptアプリに積み上げ横棒グラフとグループ化横棒グラフを追加 Vizuly Bar Chart supports both stacked and clustered layout options, as well as over 2 dozen different dynamic styles. It also comes bundled with a test container and examples of different style based themes. You can ... 続きを読む