


公式サプライヤー
公式および認定ディストリビューターとして200社以上の開発元から正規ライセンスを直接ご提供いたします。
当社のすべてのブランドをご覧ください。
Telerik UI for WPF is a robust suite of over 150 user interface components designed for Windows Presentation Foundation, enabling developers to build modern, high-performance desktop applications. It includes controls like data grids, charts, schedulers, and editors, optimized for seamless integration and support for MVVM (Model-View-ViewModel) patterns. With features like built-in theming, responsive layouts, and customizable styling, it simplifies the creation of visually appealing, intuitive interfaces. Ideal for enterprise-grade or consumer-facing apps, Telerik UI for WPF accelerates development while ensuring professional-quality results.
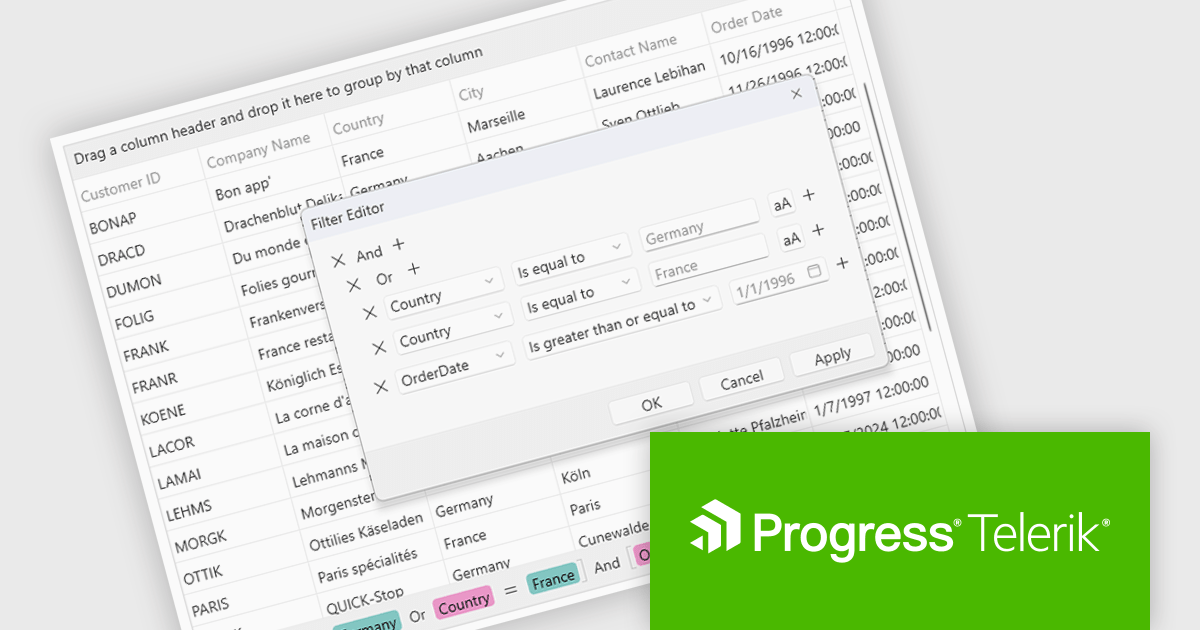
The Telerik UI for WPF 2024 Q4 (2024.4.1111) update enhances RadGridView with a new filtering mode that supports complex expressions, providing developers with greater control and precision when working with data. This feature introduces an intuitive Filter Editor that combines a clear Data Filter View for visualizing applied criteria with the powerful RadDataFilter control for adding, editing, and managing filters. Key usability enhancements, such as optional wrapping for readability, quick enable/disable options for filters, and streamlined access to editing tools, make it easier to implement dynamic, customizable filtering experiences in applications, empowering developers to deliver highly responsive and user-centric interfaces.
To see a full list of what's new in 2024 Q4, see our release notes.
Telerik UI for WPF is licensed per developer and is available as a perpetual license with a one year support subscription, which is available in three tiers: Lite, Priority or Ultimate. See our Telerik UI for WPF licensing page for full details.
Telerik UI for WPF is available individually or as part of the following products:
Spread.NET by MESCIUS is a versatile spreadsheet component for .NET applications, enabling developers to integrate Excel-compatible functionalities into Windows Forms, WPF and ASP.NET. With features like advanced data visualization, pivot tables, conditional formatting, and customizable formulas, Spread.NET handles large data sets efficiently and allows seamless Excel import/export. This tool is ideal for applications needing robust data analytics and reporting, such as financial software and business intelligence solutions, enhancing user experience with a familiar spreadsheet interface.
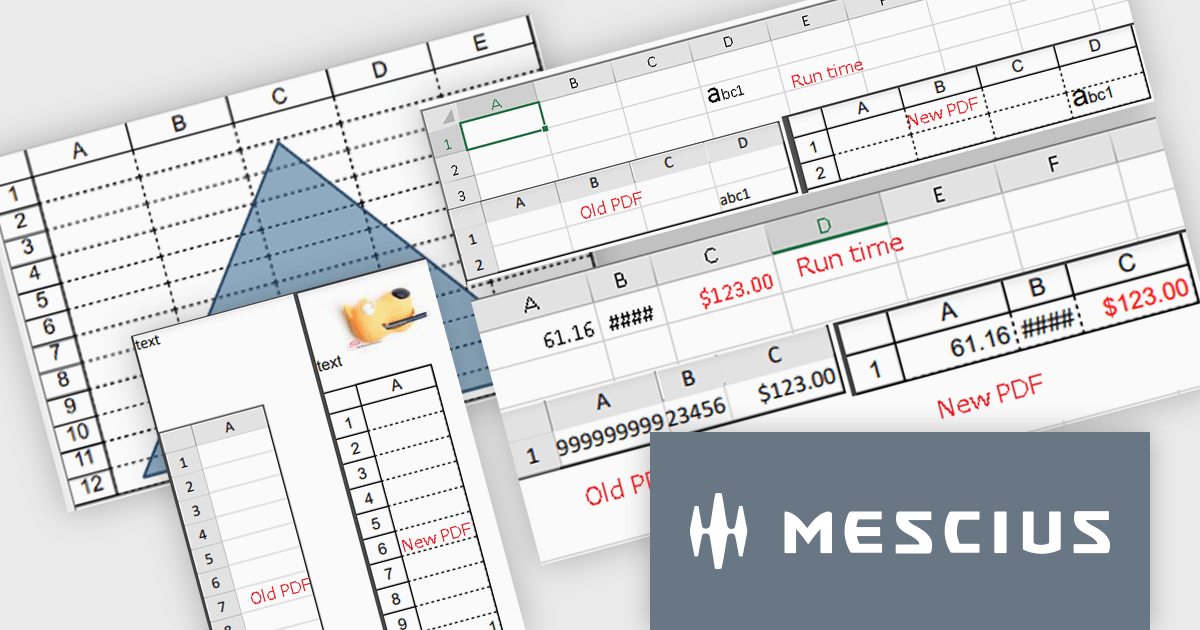
The Spread.NET 18 update enhances PDF export capabilities by delivering high-resolution outputs with improved image quality and rendering precision. This update aligns closely with Excel-compatible printing features, ensuring accurate representation of rich text, flat style modes, transparent shapes and header/footer images in PDF documents. Developers can now save individual sheets, entire workbooks or directly print to PDF, providing greater flexibility and efficiency. With these improvements, the PDF export functionality meets professional-grade standards, making it a reliable tool for creating polished, high-quality outputs directly from .NET spreadsheets.
To see a full list of what's new in version 18, see our release notes.
Spread.NET is licensed per developer and is available as a Perpetual License with a 12 month support and maintenance subscription. We can supply any Spread.NET license including new licenses, maintenance renewals, and upgrade licenses. See our Spread.NET licensing page for full details.
For more information, visit our Spread.NET product page.
ComponentOne Studio Enterprise by MESCIUS is a robust toolkit for .NET developers, offering an extensive suite of UI controls and tools tailored for building powerful desktop applications using WinForms, WPF, and other technologies. With its rich set of pre-built components, including advanced data grids, charts, and reporting tools, it enables developers to create visually appealing and highly functional applications with ease. By streamlining development and minimizing the need for custom coding, ComponentOne Studio Enterprise accelerates project timelines and enhances productivity, empowering developers to focus on delivering feature-rich and polished desktop solutions efficiently.
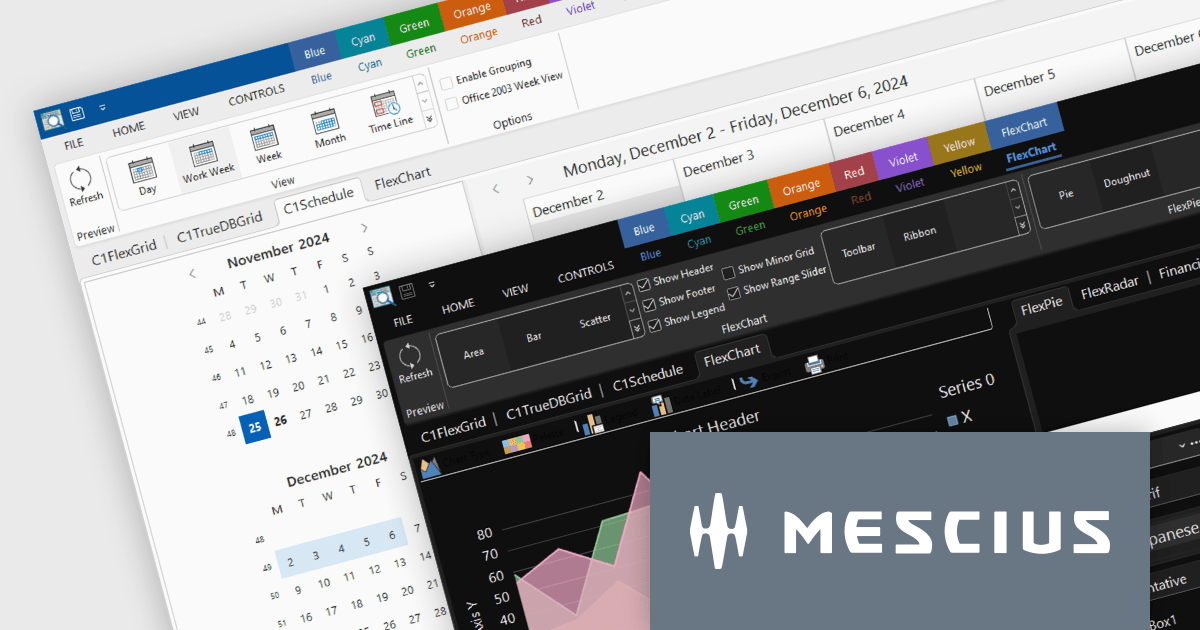
The ComponentOne Studio Enterprise 2024 v2 update introduces production-ready Microsoft Office 365 themes for Windows Forms and WPF controls, enabling developers to deliver desktop applications with modern, professional aesthetics that align with the latest Windows software styles. These themes include multiple variations such as white, gray, dark, green, and colorful, offering developers the flexibility to customize their applications to suit different user preferences and branding requirements. This enhancement streamlines the process of creating visually cohesive and up-to-date user interfaces for desktop applications.
To see a full list of what's new in 2024 v2, see our release notes.
ComponentOne Studio products are licensed per developer on a perpetual basis and include a 12 month subscription. Priority Support is also available. See our licensing pages below for full details:
For more information see the following product pages:

Undo and redo functionality in a spreadsheet allows users to reverse or reapply actions made during editing, providing a straightforward way to correct mistakes or recover changes. The undo option enables users to step back through recent actions, such as data entry, formatting, or formula adjustments, while redo restores any actions reversed by the undo function. This capability provides a safety net, allowing users to recover from unintended modifications, thereby enhancing productivity as it minimizes errors and streamlines the editing process.
Several WPF spreadsheet components allow you to redo and undo editing changes, including:
For an in-depth analysis of features and price, visit our WPF spreadsheet controls comparison.
Syncfusion Essential Studio WPF, available as part of Syncfusion Essential Studio Enterprise, is a powerful suite of over 95 UI controls, 50+ charts, and document processing libraries designed to boost the development of high-performance line-of-business applications for the Windows Presentation Foundation (WPF) framework. With built-in themes, touch-friendly interfaces, and seamless Visual Studio integration, it empowers developers to craft modern, feature-rich, and cross-platform experiences with ease.
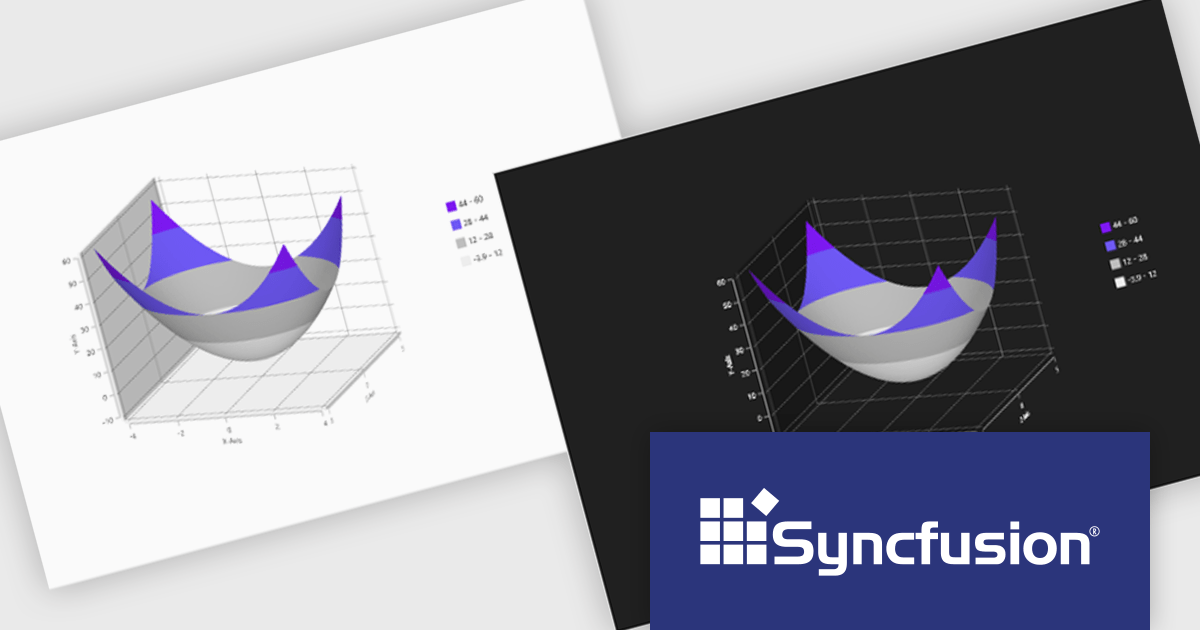
The Syncfusion Essential Studio WPF 2024 Volume 3 release adds theming support to the Surface Chart. By enabling the modification of color palettes, font styles, axis labels, and overall layout, theming empowers users to create visually striking and informative charts that align with specific branding guidelines or user preferences. This flexibility not only improves the chart's aesthetic quality but also contributes to a more engaging and intuitive user experience.
To see a full list of what's new in 2024 Volume 3, see our release notes.
Syncfusion Essential Studio WPF is available as part of Syncfusion Essential Studio Enterprise which is licensed per developer starting with a Team License of up to five developers. It is available as a 12 Month Timed Subscription License which includes support and maintenance. See our Syncfusion Essential Studio Enterprise licensing page for full details.
Learn more on our Syncfusion Essential Studio WPF product page.
電話: (888) 850 9911
Fax: +1 770 250 6199


