


公式サプライヤー
公式および認定ディストリビューターとして200社以上の開発元から正規ライセンスを直接ご提供いたします。
当社のすべてのブランドをご覧ください。
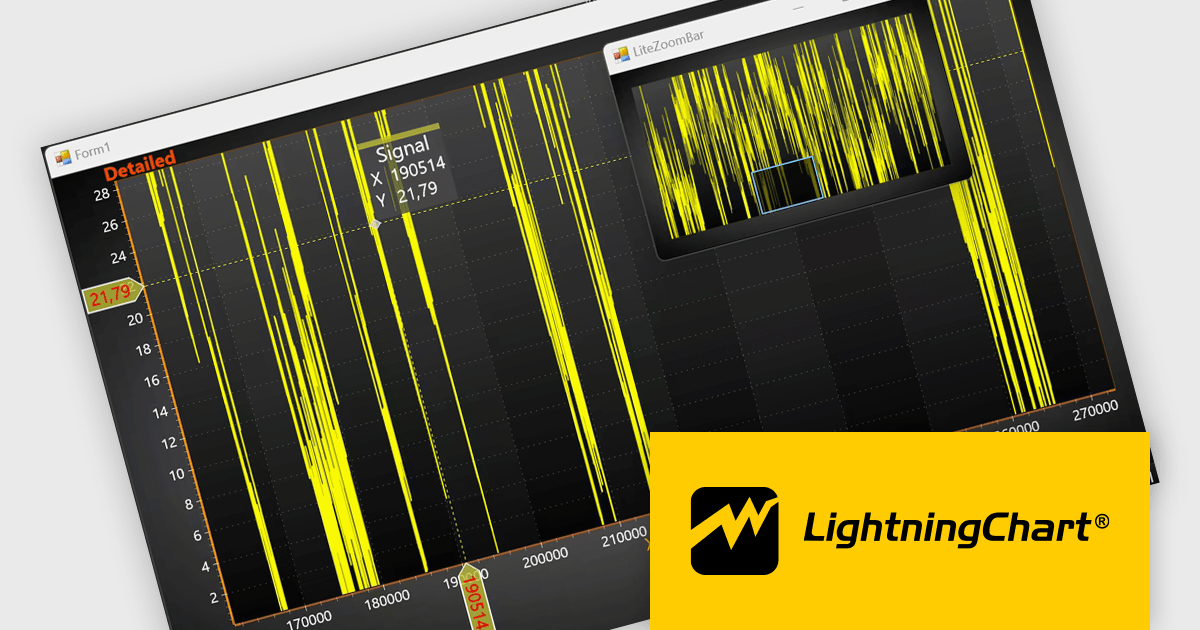
LightningChart .NET is a high-performance data visualization library designed for .NET developers working with WPF, WinForms, and UWP applications. It offers GPU-accelerated rendering for smooth real-time visualization of massive datasets, exceeding billions of data points. This library supports a wide variety of chart types, including 2D, 3D, polar, and geographic maps, along with extensive customization options for each. LightningChart .NET is a powerful tool for developers creating demanding data visualization applications requiring exceptional performance.
The LightningChart .NET v12.4.1 update enhances data visualization and navigation, allowing developers to display an overview of the entire dataset alongside a zoomed-in chart view - improving context awareness when analyzing large or complex data. The new LiteZoomBar offers a lightweight, memory-efficient alternative for applications requiring optimized performance. This tool provides greater control and efficiency in exploring and interpreting chart data.
To see a full list of what's new in v12.4.1, see our release notes.
LightningChart .NET is available per developer in packages for either WPF, WinForms, UWP or all 3. Each package comes as a subscription license (with 1 or 2 years of limited support), or a perpetual license (with 1 or 2 years of Standard or Premium support). Floating licenses and site licenses are available upon request. See our LightningChart .NET licensing page for full details.
Learn more on our LightningChart .NET product page.
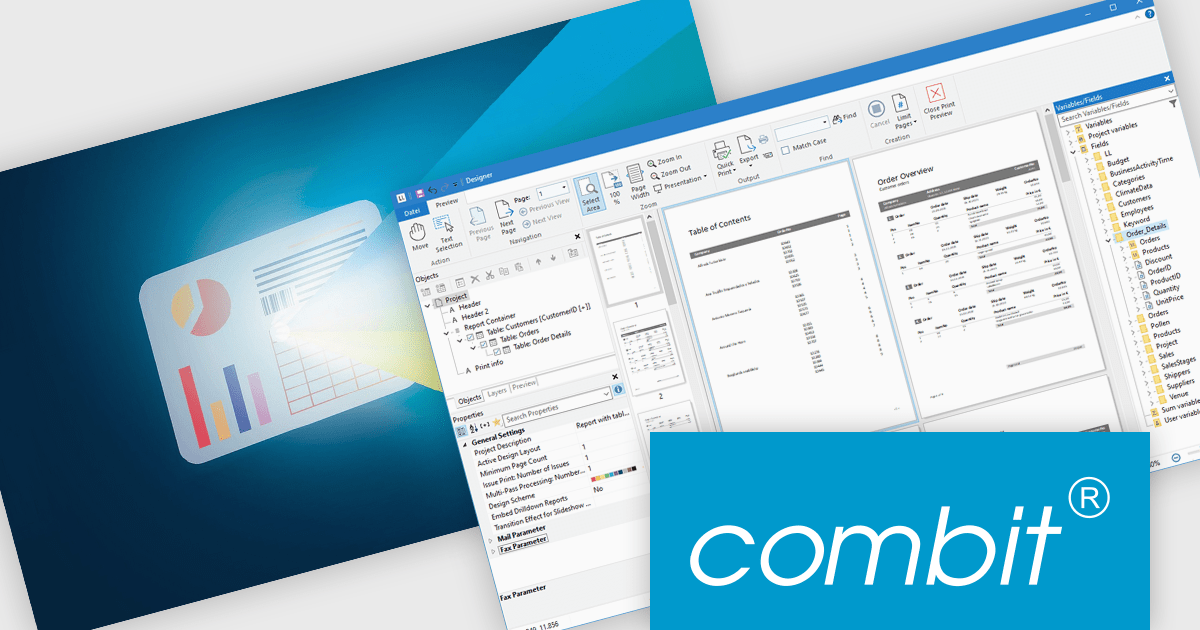
List & Label by combit is a software development toolkit that empowers developers to integrate comprehensive reporting functionalities into their desktop, web, and cloud applications. It offers features such as data binding, complex data visualization, and a user-friendly report designer, along with printing, exporting, and previewing capabilities. List & Label operates independently of programming languages and data sources, providing developers with the flexibility to design and deliver informative reports within their development environment.
The List & Label 31 update introduces cross-platform reporting, enabling developers to design, generate, and distribute reports across Windows, macOS, Linux, and web environments. This enhancement ensures consistent performance, layout accuracy, and data representation on every platform while reducing the need for multiple platform-specific implementations. By unifying the reporting process within a single framework, developers can deliver a cohesive reporting experience to all users, regardless of their operating system.
To see a full list of what's new in version 31, see our release notes.
List & Label is licensed per developer and is available as a Perpetual License with a 12 month support and maintenance subscription. See our List & Label licensing page for full details.
For more information, visit our List & Label Enterprise Reporting Edition product page.
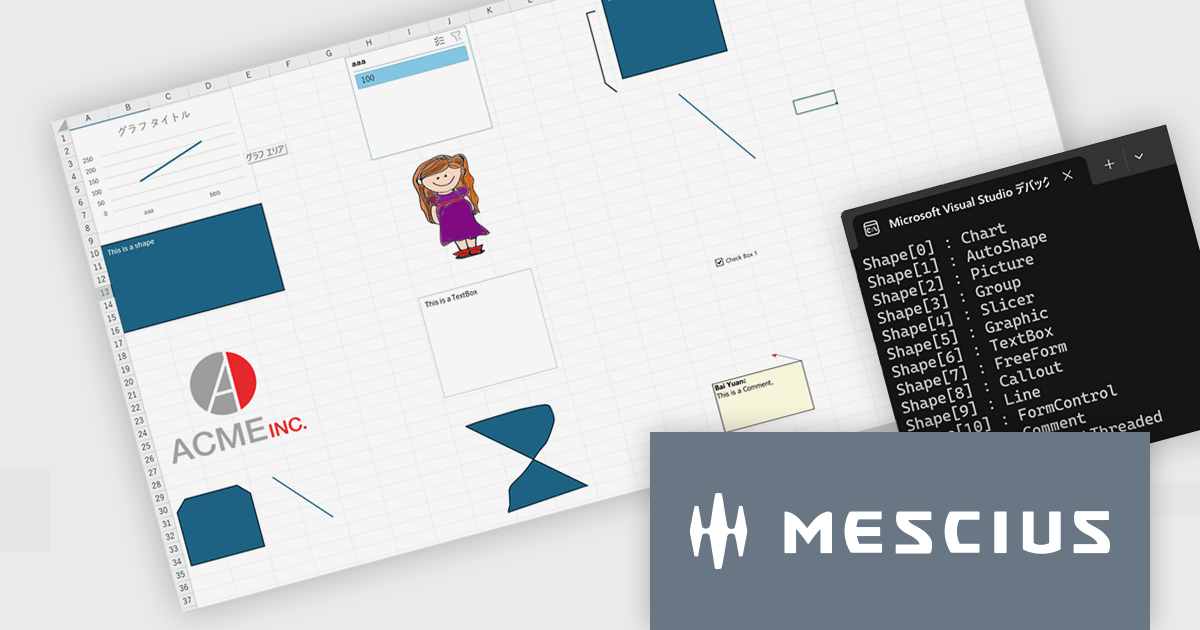
このバージョンでは、Excel操作APIとして重要な数式処理・帳票テンプレート生成・ファイル操作の3領域において、処理パフォーマンスの大幅な改善が実現されています。具体的には、VLOOKUP、XLOOKUP、HLOOKUP、LOOKUP、MATCH、XMATCH、UNIQUE など幅広い検索・計算系関数に対し、大規模な範囲に対する文字列検索性能が強化されました。また、AVERAGEIF の条件付き平均や POISSON.DIST、COMBIN といった関数でも、大きな引数を扱う場面での実行速度が改善されています。
帳票テンプレートの分野では、ITableDataSource を利用して大規模データを処理する際のメモリ使用量が削減され、長大な帳票を生成する際のシステム負荷が軽減されています。また、ワークブックの開閉や保存時に DefinedNames が多数含まれている場合でも、処理が速くなっており、ファイル操作の効率性も上がっています。
Excel帳票・計算処理を伴う業務アプリケーション開発において、特に大量データを扱ったり複雑な数式やテンプレートを頻用している開発現場では、V8J SP2の性能改善は即効的な効果が期待されます。
V8J SP2の新機能については、リリースノートをご覧ください。
DioDocs(日本語版)シリーズの製品や販売情報の詳細は下記のリンクをご参考ください。
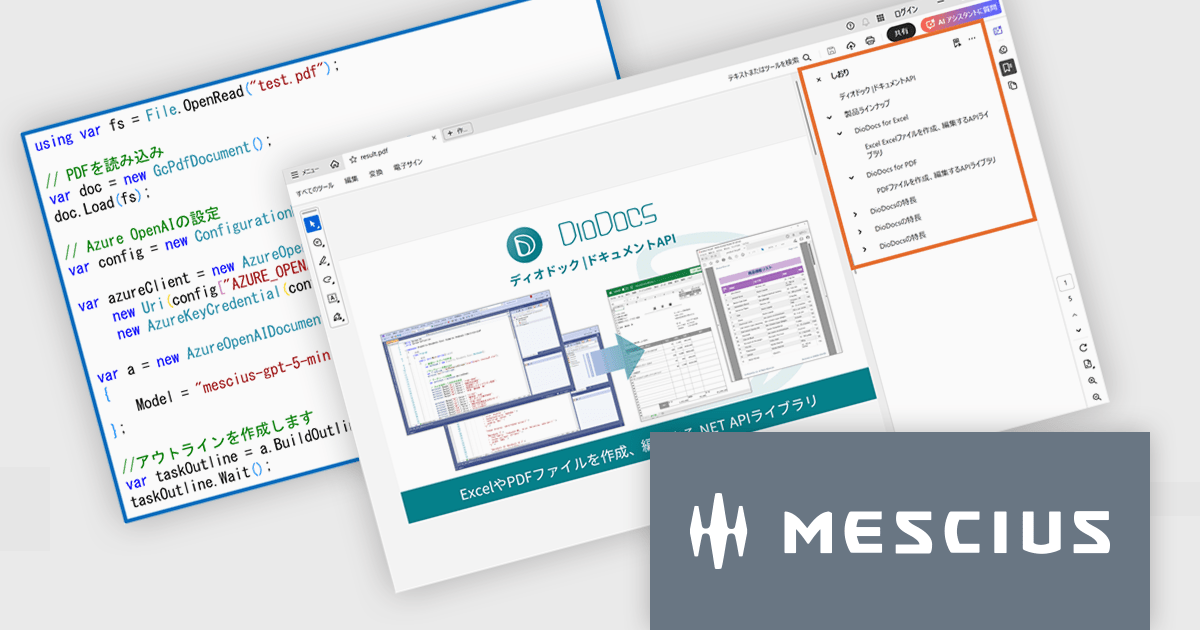
DioDocs for PDFのV8J SP2最新バージョンでは、AI技術を活用してPDF文書の解析・整理を支援する「AIアシスタント機能」が搭載されました。この機能はOpenAIおよびAzure OpenAI Serviceと連携し、ドキュメント内容の要約、アウトライン(目次)生成、テーブルデータ抽出といった作業を自動的に行えます。
要約機能では、長文のレポートや技術資料から重要な情報を抽出し、簡潔なサマリーを生成します。これにより、文書全体を読む時間を短縮し、要点を素早く把握できるようになります。アウトライン生成では、文書構造を自動的に分析し、章や節ごとの目次を作成します。これによりPDF内のナビゲーション性が向上し、資料を効率的に閲覧できます。さらに、テーブル抽出機能を利用すると、PDF内の表をAIが認識し、必要なデータを抽出して再利用できます。これにより、分析やレポート作成などの後工程がスムーズになります。
AIアシスタント機能の導入によって、従来手作業で行っていた要約作成や目次整理の負担が軽減され、業務効率が大幅に向上します。特に、大量のドキュメントを扱う企業や、情報整理に時間を要する部門にとって有効です。今回のアップデートにより、DioDocs for PDFは単なるPDF操作ツールから、AIによる情報活用を支援するスマートなドキュメントソリューションへと進化しました。業務のスピードアップと生産性向上を実現する新機能として、ぜひ活用を検討してみてください。
V8J SP2の新機能については、リリースノートをご覧ください。
DioDocs(日本語版)シリーズの製品や販売情報の詳細は下記のリンクをご参考ください。
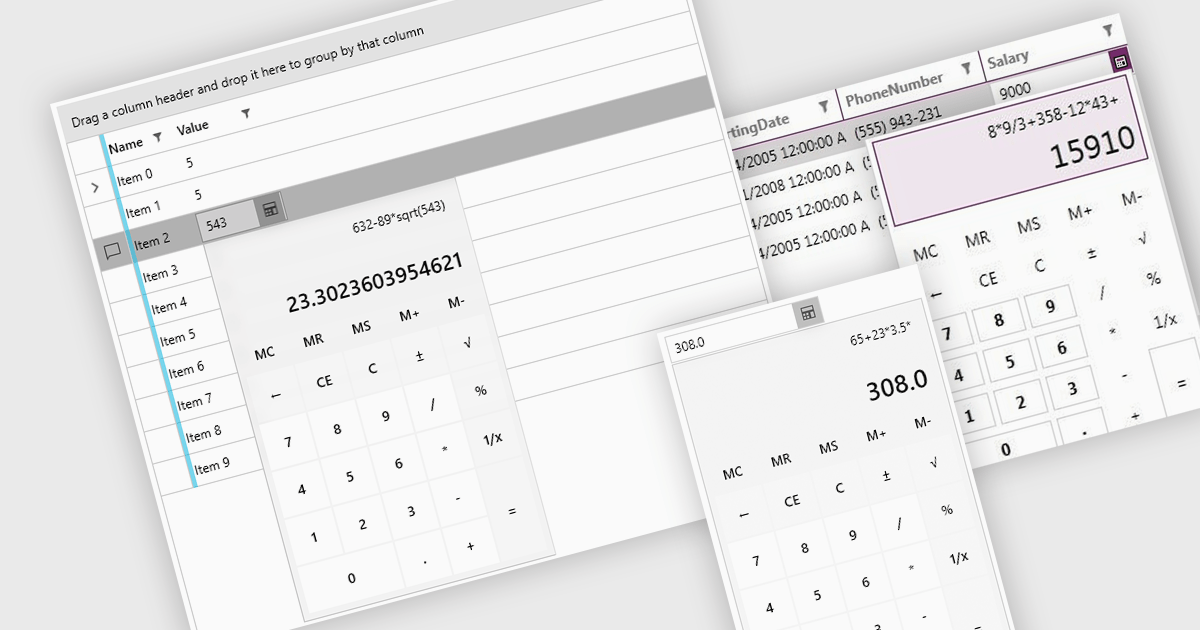
Dropdown calculators are interactive user interface components that integrate a compact calculator directly into a standard dropdown control, allowing users to perform quick calculations or adjust numerical values without navigating away from the current input field. This interaction pattern is particularly useful in data-heavy applications where users frequently need to input or modify numerical data, such as e-commerce pricing, financial tools, form-based systems, or configuration panels. By integrating calculation capabilities directly into the dropdown, these components reduce the need for external tools, help maintain focus, and improve the overall speed and accuracy of user input.
Several WPF data editor collections offer a dropdown calculator, including:
For an in-depth analysis of features and price, visit our comparison of WPF data editors collections.
電話: (888) 850 9911
Fax: +1 770 250 6199


