


公式サプライヤー
公式および認定ディストリビューターとして200社以上の開発元から正規ライセンスを直接ご提供いたします。
当社のすべてのブランドをご覧ください。
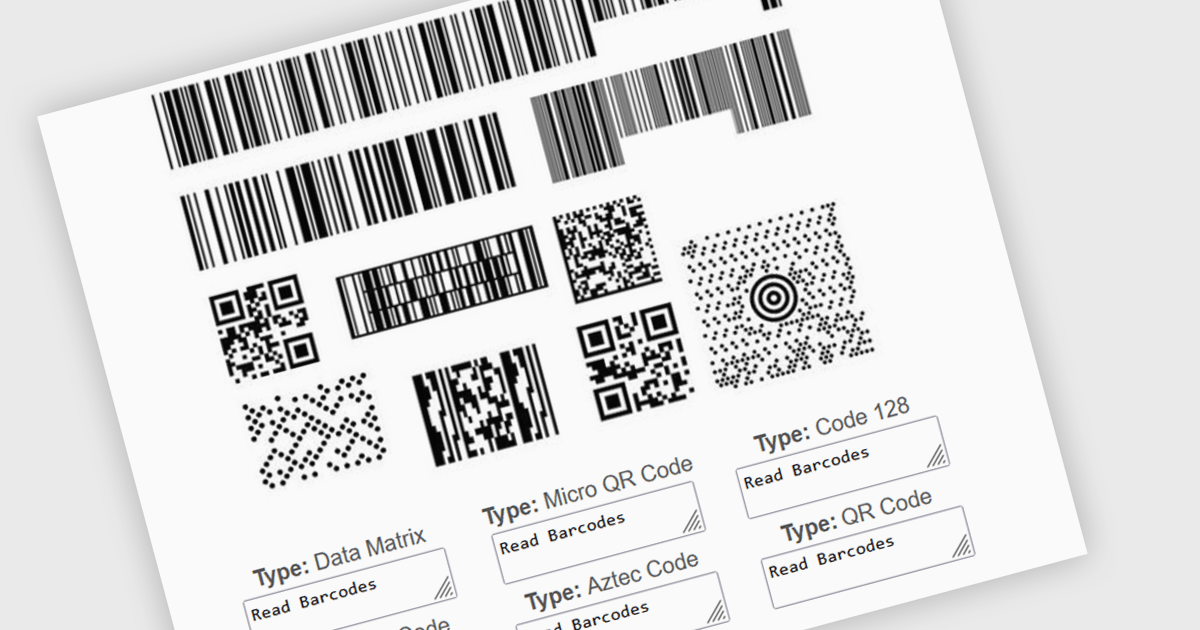
Multiple barcode detection within a barcode component refers to the capability of a system to identify and process multiple barcodes simultaneously within a single image or document. This functionality enables efficient and accurate data extraction from various sources, such as product packaging, shipping labels, and inventory documents. By automating the process of detecting and decoding multiple barcodes, developers can significantly improve the speed and reliability of data input, reduce human error, and enhance overall system performance.
Several .NET barcode components support multiple barcode detection including:
Explore our range of .NET barcode products with multiple barcode detection within Barcode Components.
Need help to find the right software license, upgrade or renewal? Call, Email, or Live Chat with our experts.
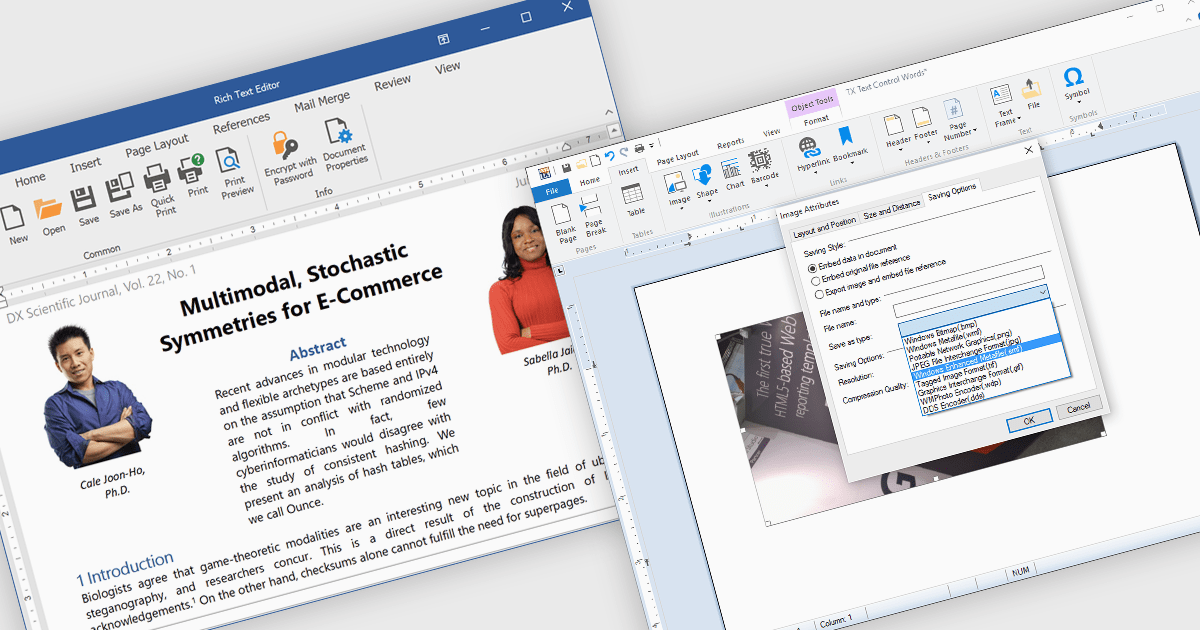
The integration of images within a rich text component enhances the flexibility and visual appeal of digital content by allowing users to embed and format images directly alongside text. This functionality supports a more immersive, informative experience, as images can clarify complex ideas, provide visual examples, or highlight key points within a block of text. For instance, in a blog post, users can insert images to illustrate steps in a tutorial, while marketers may use embedded images to create visually engaging product descriptions within a text editor. This approach streamlines workflows by eliminating the need for separate image and text components, offering a unified platform for visually enriched content creation. The rich text component's support for embedded images facilitates a dynamic presentation, fostering greater user engagement and enhancing readability.
Several .NET WinForms products offer image insertion within rich text components including:
Explore our range of .NET WinForms rich text editors within Word Processing Components.
Need help to find the right software license, upgrade or renewal? Call, Email, or Live Chat with our experts.
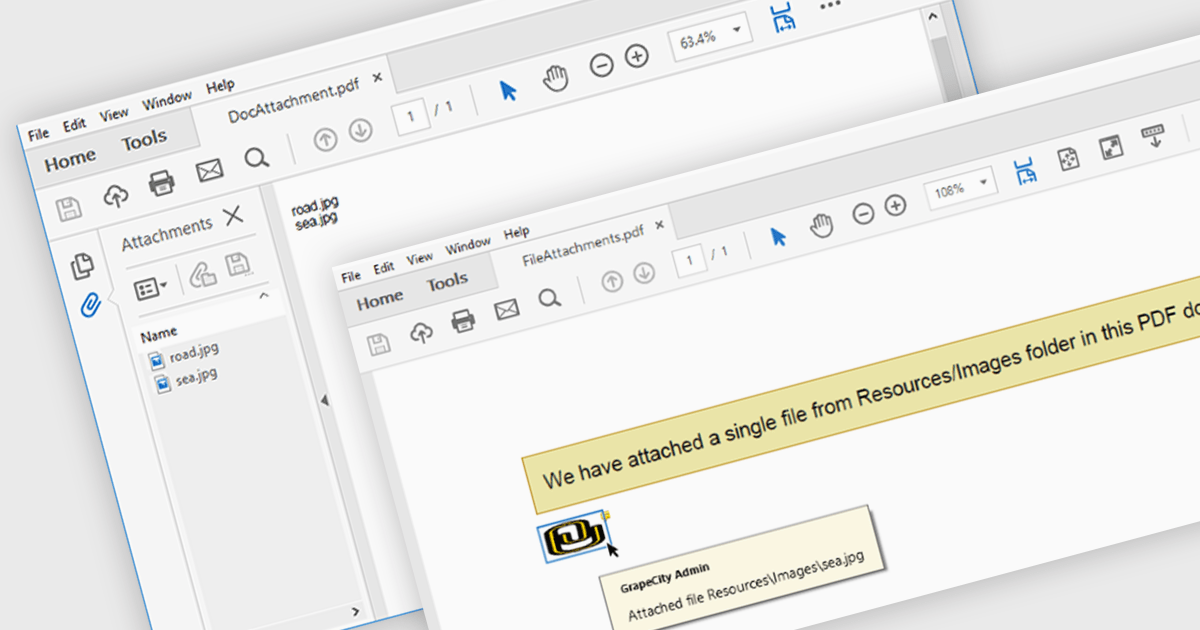
The ability to attach files to a PDF enables seamless integration of supplementary documents directly into the primary PDF file. This functionality streamlines workflows by consolidating related materials into a single, easily accessible package. Developers can leverage this feature to enhance document organization, improve collaboration, and provide a more comprehensive user experience.
Several .NET PDF components offer support for attaching files to a PDF including:
For an in-depth analysis of features and price, visit our comparison of .NET PDF components.
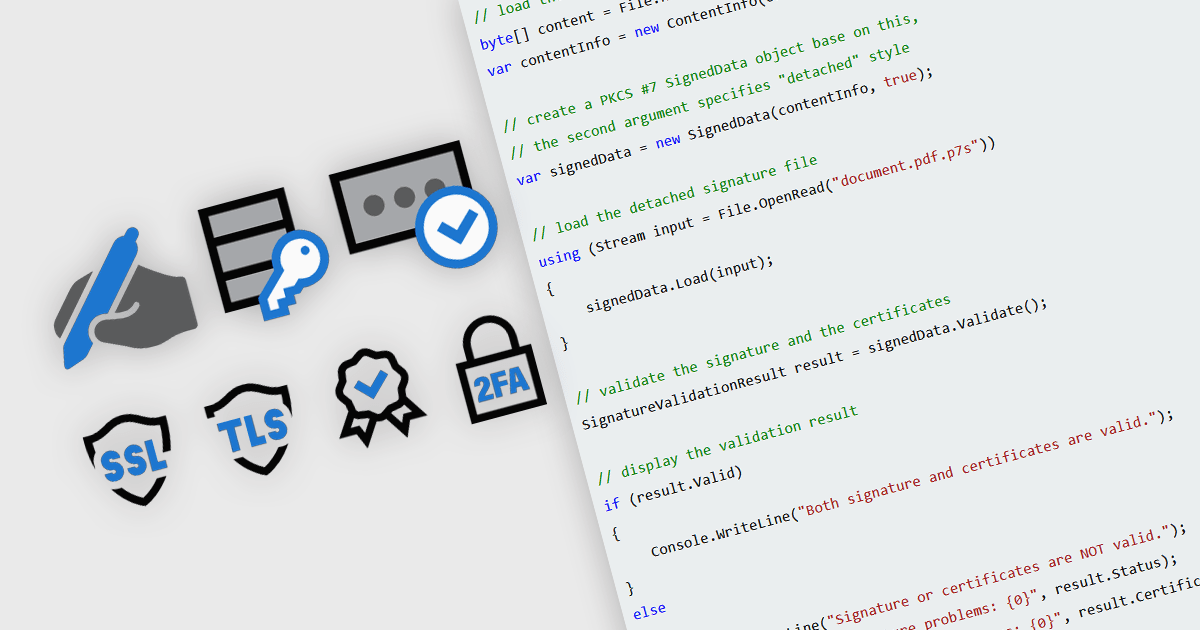
In modern communications and messaging platforms, security features are essential for safeguarding data integrity, user privacy, and system reliability. These features encompass a range of protocols and mechanisms designed to protect data from unauthorized access, ensure data authenticity, and verify the identity of communicating parties. By integrating security measures such as encryption, authentication, and digital certificates, organizations can mitigate risks and enhance trust within their digital ecosystems. Effective security within messaging and communication systems not only prevents data breaches but also ensures compliance with regulatory standards and supports secure collaboration across teams and partners.
Common features include:
For an in-depth analysis of features and price, visit our .NET communications and messaging components comparison.
Syncfusion Essential Studio WPF, available as part of Syncfusion Essential Studio Enterprise, is a powerful suite of over 95 UI controls, 50+ charts, and document processing libraries designed to boost the development of high-performance line-of-business applications for the Windows Presentation Foundation (WPF) framework. With built-in themes, touch-friendly interfaces, and seamless Visual Studio integration, it empowers developers to craft modern, feature-rich, and cross-platform experiences with ease.
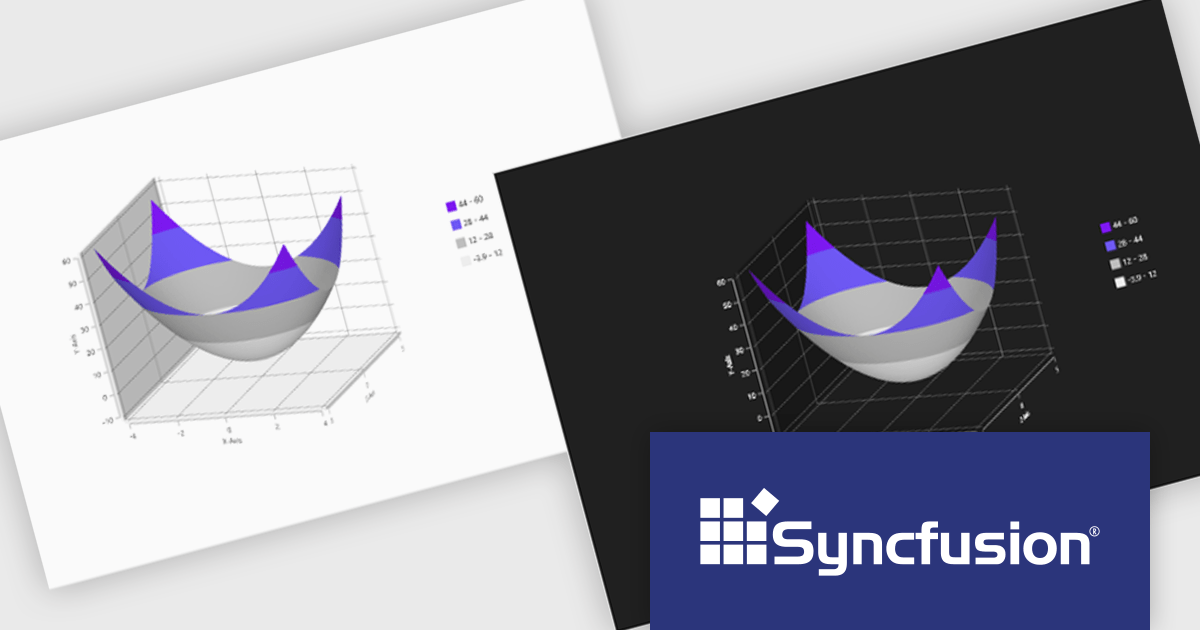
The Syncfusion Essential Studio WPF 2024 Volume 3 release adds theming support to the Surface Chart. By enabling the modification of color palettes, font styles, axis labels, and overall layout, theming empowers users to create visually striking and informative charts that align with specific branding guidelines or user preferences. This flexibility not only improves the chart's aesthetic quality but also contributes to a more engaging and intuitive user experience.
To see a full list of what's new in 2024 Volume 3, see our release notes.
Syncfusion Essential Studio WPF is available as part of Syncfusion Essential Studio Enterprise which is licensed per developer starting with a Team License of up to five developers. It is available as a 12 Month Timed Subscription License which includes support and maintenance. See our Syncfusion Essential Studio Enterprise licensing page for full details.
Learn more on our Syncfusion Essential Studio WPF product page.
電話: (888) 850 9911
Fax: +1 770 250 6199


