


公式サプライヤー
公式および認定ディストリビューターとして200社以上の開発元から正規ライセンスを直接ご提供いたします。
当社のすべてのブランドをご覧ください。
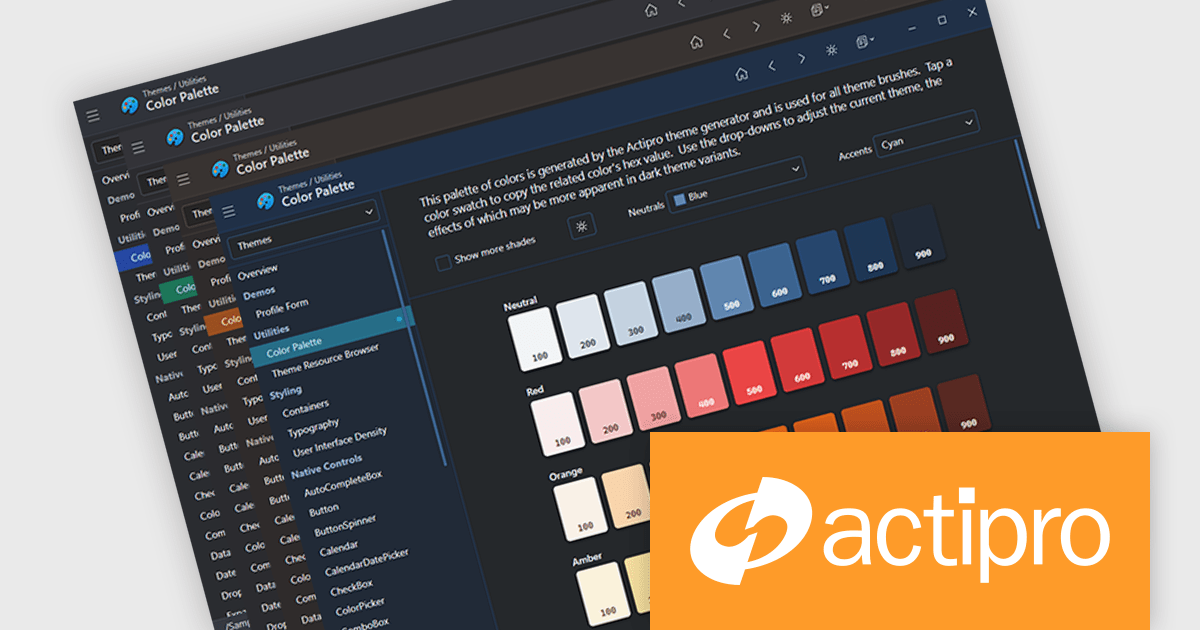
Actipro Avalonia UI Pro is a suite of professionally designed UI controls, themes, and components specifically built for the Avalonia UI framework. It empowers developers to craft beautiful, modern cross-platform applications while leveraging their existing C# and WPF skills. Actipro offers a range of controls from essential navigation and data visualization components to advanced charting and scheduling features, all adhering to its signature high-quality design and seamless integration with Avalonia.
The Avalonia Controls v25.2.1 update adds color palette customization, enabling developers to define and adjust the factory responsible for generating theme color palettes. This enhancement allows precise control over color ramps and the ability to apply consistent tinting across the entire theme, ensuring applications can adopt any required brand or design specification. By simplifying the process of modifying palette colors, the update reduces the effort needed to achieve uniform styling across components and provides flexibility to create distinctive appearances that align with both functional and aesthetic requirements.
To see a full list of what's new in 25.2.1, see our release notes.
Actipro Avalonia UI Pro is licensed per developer and is available as a Perpetual license with 1 year support and maintenance. See our Actipro Avalonia UI Pro licensing page for full details.
Learn more on our Actipro Avalonia UI Pro product page.
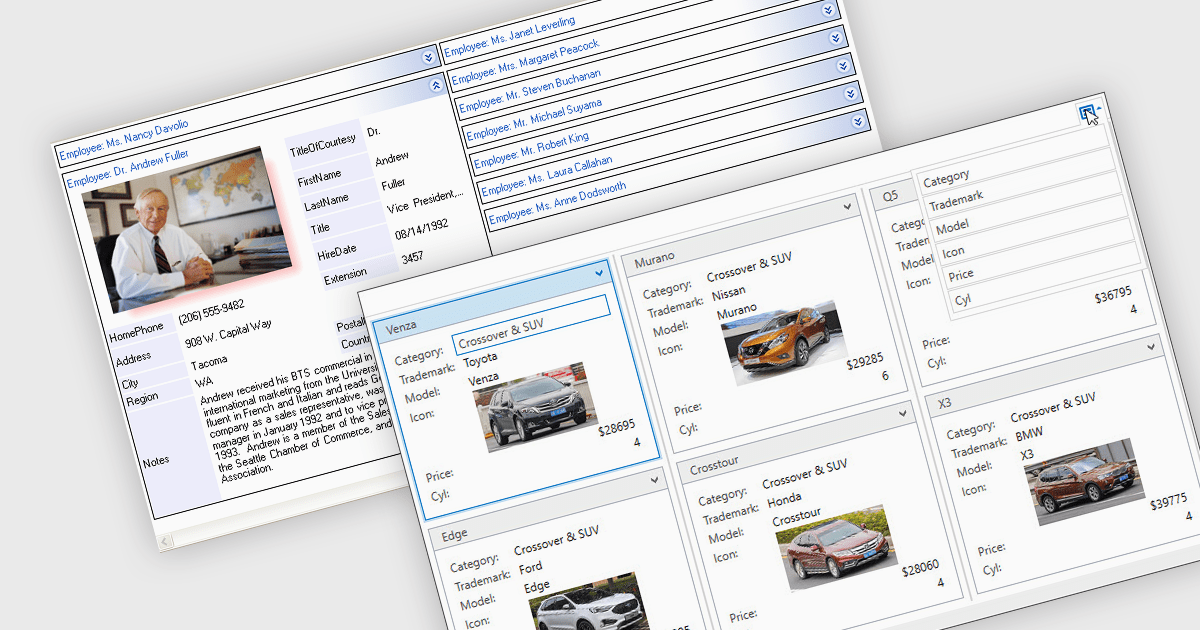
Card view is a grid layout option that displays data as a series of individual cards arranged in rows and columns, rather than as traditional table rows. Each card encapsulates related fields, often with custom formatting and embedded controls, allowing for more visual and flexible presentation of complex data. This format is especially beneficial in scenarios where users need to review, interact with, or compare structured records involving rich content or media in a more engaging and user-friendly layout.
Several .NET grid components allow you to use card view, including:
For an in-depth analysis of features and price, visit our comparison of .NET grid components.
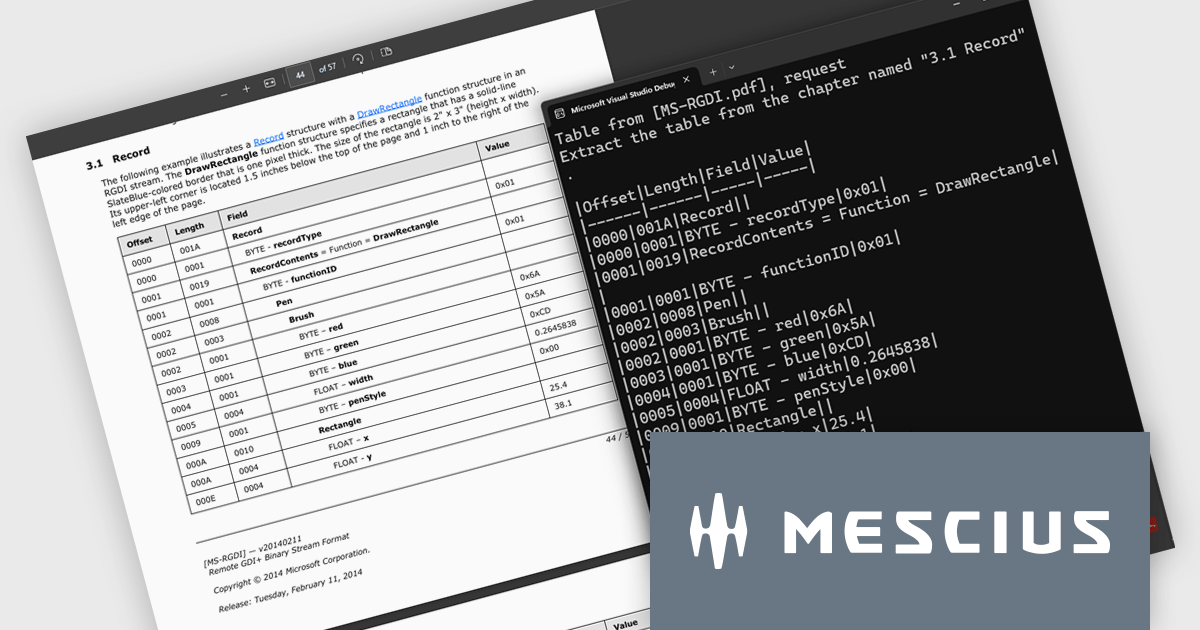
Document Solutions for PDF (DsPdf) by MESCIUS is a software development toolkit that provides .NET Core libraries and a JavaScript PDF viewer for manipulating and displaying PDFs. DsPdf enables developers to create, edit, annotate, and redact PDF documents directly within web applications. The included DsPdfViewer component offers a feature-rich, cross-platform solution for viewing and interacting with PDFs in modern browsers on various operating systems, including mobile devices.
The Document Solutions for PDF v8.2 update introduces a new AI-powered capability to extract tables from documents, enabling developers to convert unstructured tabular data in PDFs into structured, machine-readable formats with ease. By leveraging natural language prompts through OpenAI or Azure OpenAI services, this feature eliminates the need for manual parsing or coordinate-based extraction, reducing development effort. It provides reliable output even from PDFs with complex layouts or inconsistent formatting.
To see a full list of what's new in version 8.2, see our release notes.
Document Solutions for PDF is licensed per developer and is available in several license options for differing distribution needs. Team licenses are also available for multiple developers within the same organization. See our Document Solutions for PDF licensing page for full details.
Document Solutions for PDF is available to buy individually or as part of Document Solutions .NET Bundle.
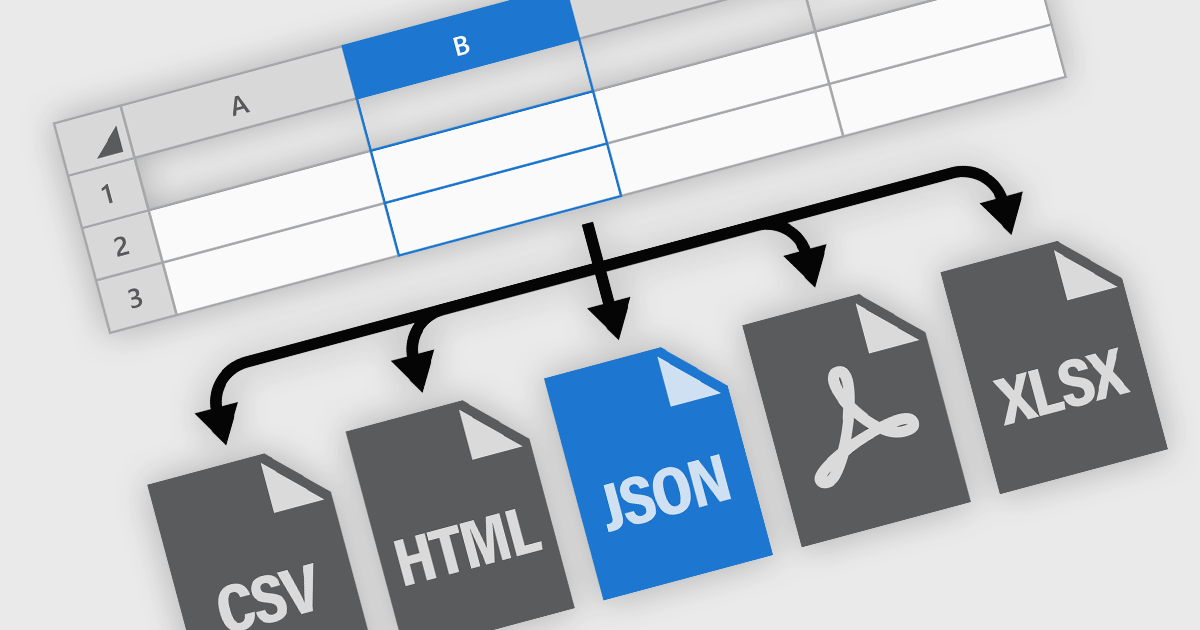
Spreadsheet components in modern UI frameworks offer robust capabilities for exporting and printing data, enabling users to take structured, interactive grid content and transform it into static or sharable formats. These features are crucial in enterprise applications, where end users often need to generate reports, export analysis results, or share datasets in widely recognized formats. Whether integrated into financial dashboards, inventory systems, or business intelligence tools, export and print functionalities ensure that grid data remains portable, consistent, and accessible across various workflows and platforms.
Common features include:
For an in-depth analysis of features and price, visit our ASP.NET Core spreadsheet components comparison.
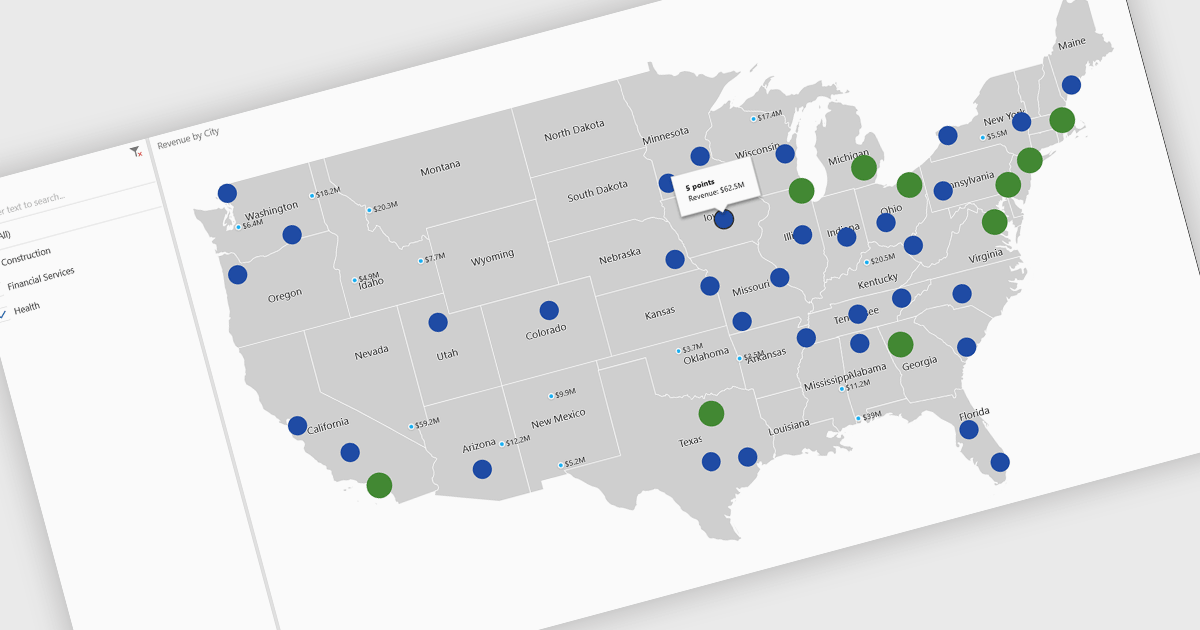
A map chart is a visual representation of data that displays values across geographic regions using colors, shading, or markers, making complex information easier to interpret. By placing data in a spatial context, map charts help users quickly identify regional patterns, trends, and outliers that might be overlooked in traditional tables or graphs. They are particularly useful for comparing values across countries, states, or counties, enabling clearer insights into geographically distributed data. Common use cases include illustrating population density, highlighting election results, analyzing sales performance by region, and presenting economic indicators. The key benefits of map charts include their ability to simplify complex datasets, provide intuitive comparisons, and support data-driven decision-making by visually connecting numbers with real-world locations.
Several .NET Core chart controls offer map charts including:
For an in-depth analysis of features and price, visit our .NET Core chart controls comparison.
電話: (888) 850 9911
Fax: +1 770 250 6199


