


公式サプライヤー
公式および認定ディストリビューターとして200社以上の開発元から正規ライセンスを直接ご提供いたします。
当社のすべてのブランドをご覧ください。
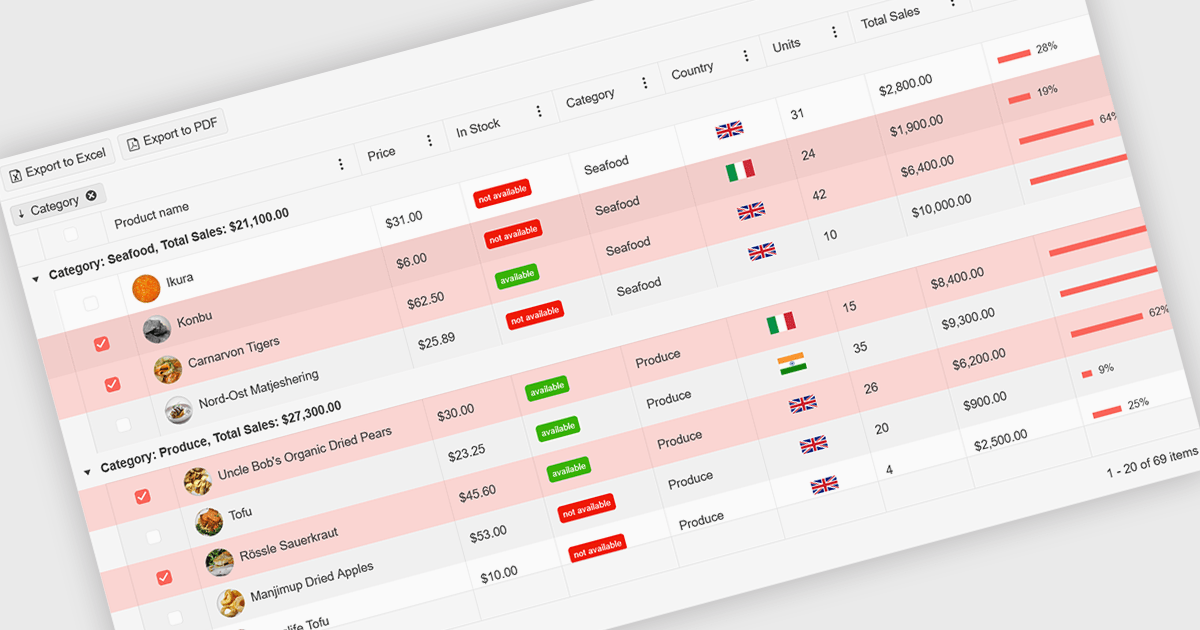
A ListBox is a user interface control that displays a collection of items, allowing users to select one or multiple entries. It supports seamless data binding, customizable item templates, and efficient performance with built-in scrolling and virtualization for large datasets. With keyboard, mouse, and accessibility support, it delivers an intuitive experience for all users. Common use cases include product catalogs, settings management, filtering datasets, and multi-item selection in forms or dashboards.
Here are some examples of ASP.NET MVC data editors collections that include a ListBox:
For an in-depth analysis of features and price, visit our comparison of ASP.NET MVC data editors.
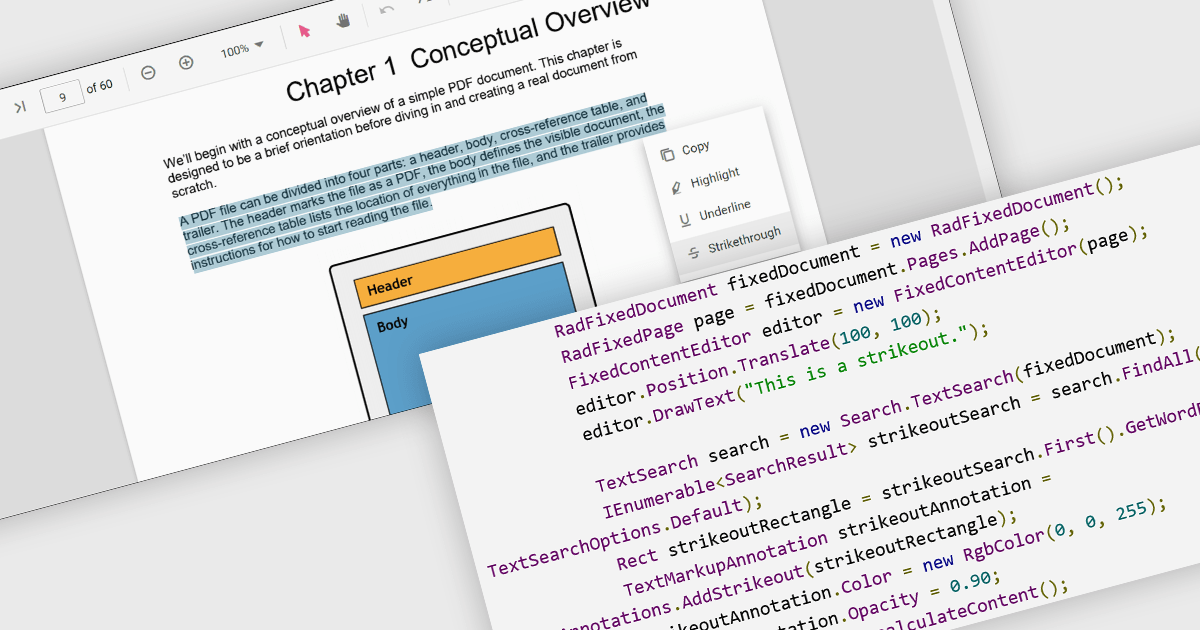
At a high level, strikethrough annotations, also known as strikeout or line-through markups, enable reviewers to visually indicate deletions or corrections within PDF text while preserving the underlying content. This annotation type belongs to the broader category of text markup annotations, which also includes highlighting, underlining, and squiggly underlines. Developers can customize properties like color, opacity, and associated notes or author metadata. Strikethrough annotations support interactive use cases, such as insert/edit/delete, event handling, and rendering consistency across different rendering engines.
Several WinForms PDF controls offer support for strikethrough annotations including:
For an in-depth analysis of features and price, visit our WinForms PDF controls comparison.
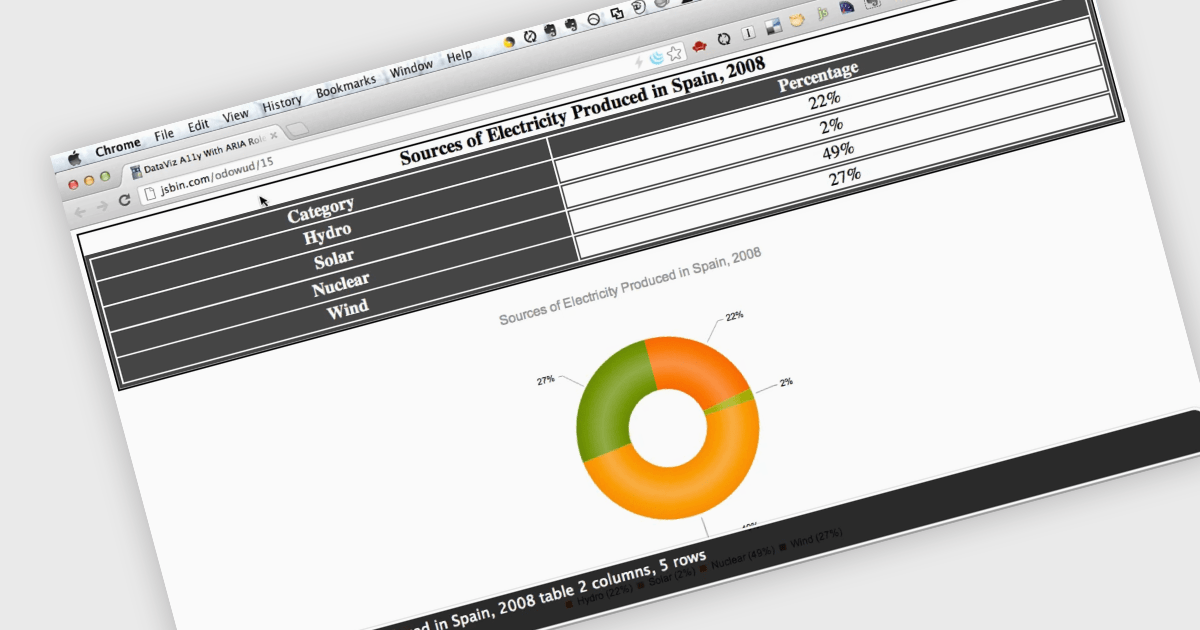
Screen readers, in the context of charts, are assistive technologies that convert digital text and interface elements into speech or braille, allowing users with visual impairments to navigate and understand graphical data on the screen. This involves adding semantic structure, descriptive labels, and metadata so the chart's content can be understood through auditory feedback, enabling users with visual impairments to understand trends, values, and relationships within the chart without needing to see the visual representation. Proper implementation not only improves usability, particularly in data driven environments, but also supports compliance with established accessibility standards such as WCAG (Web Content Accessibility Guidelines).
Several ASP.NET Core charting components support the use of screen readers, such as:
For an in-depth analysis of features and price, visit our comparison of ASP.NET Core chart components.
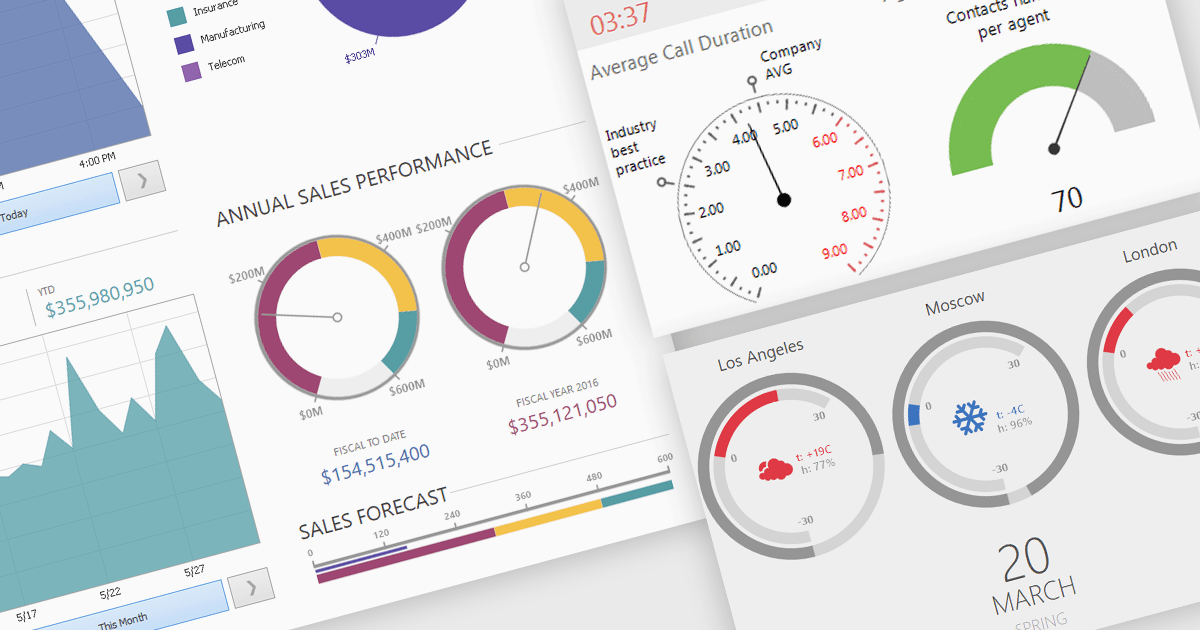
A gauge is a visual reporting element, such as a dial, meter, or progress bar, designed to display a single metric’s value in relation to defined targets or thresholds. For software developers, gauges offer a quick and intuitive way to present key performance indicators, making it immediately clear whether performance is on track, exceeding expectations, or requires attention. By transforming raw data into a simple, at-a-glance visual, gauges reduce the need for users to analyze complex tables or charts, improve the readability of dashboards and reports, and support faster, more informed decision-making.
Several .NET Winforms Reporting controls include Gauges including:
For an in-depth analysis of features and price, visit our comparison of .NET Winforms Reporting Controls.
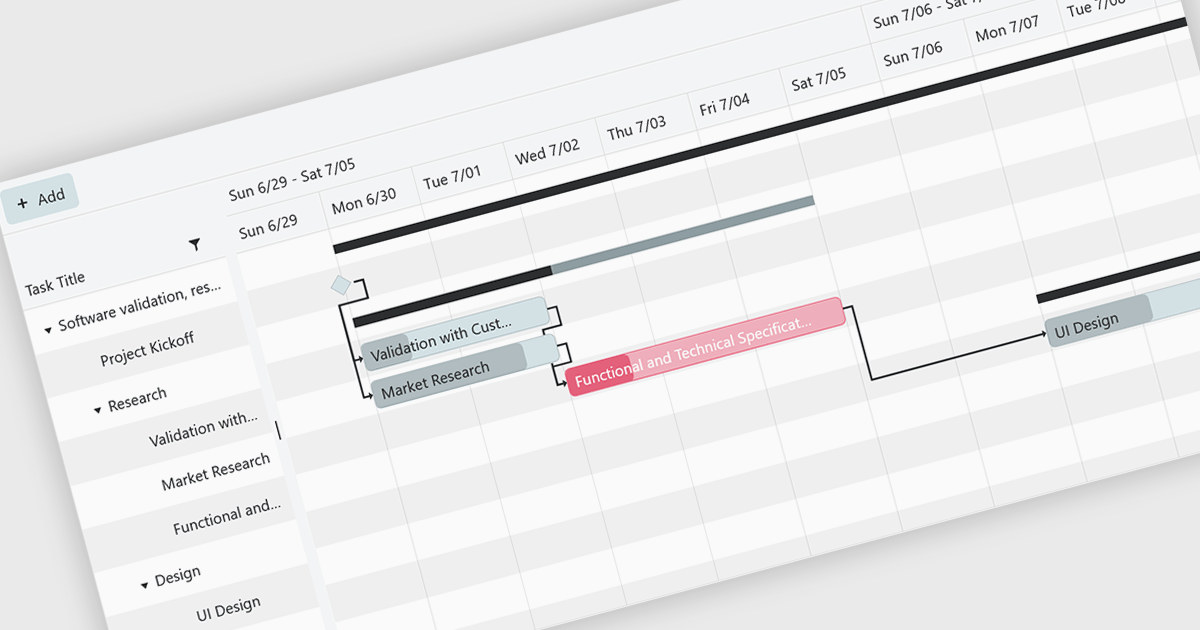
Gantt controls are invaluable tools for project management, particularly in visualizing and tracking the timeline of tasks, dependencies, and progress. These controls are ideal for illustrating project schedules, resource allocation, and critical paths. By providing a clear and concise overview of project milestones, Gantt controls facilitate effective planning, communication, and monitoring, ultimately helping organizations achieve project goals efficiently and on time.
Several .NET Blazor UI suites offer Gantt controls including:
For an in-depth analysis of features and price, visit our .NET Blazor UI suites comparison.
電話: (888) 850 9911
Fax: +1 770 250 6199


