


公式サプライヤー
公式および認定ディストリビューターとして200社以上の開発元から正規ライセンスを直接ご提供いたします。
当社のすべてのブランドをご覧ください。
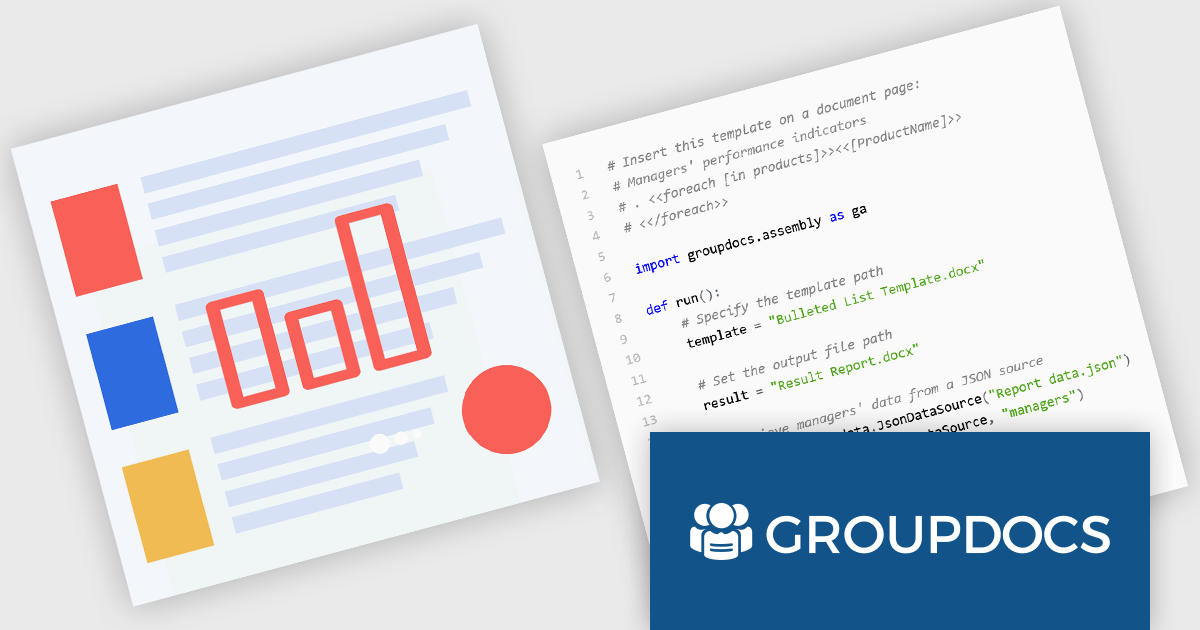
GroupDocs.Assembly for Python via .NET is a powerful document automation library designed to facilitate the dynamic creation of documents from templates. Built on the robust GroupDocs.Assembly engine, this Python-compatible solution leverages the .NET framework to enable developers to programmatically populate documents such as Word, PDF, Excel, and PowerPoint files using structured data sources. By integrating with popular file formats and maintaining high fidelity in output, it supports a wide range of document automation scenarios within Python applications.
The product is particularly useful in environments where large-scale, data-driven document generation is essential. Common use cases include producing customized reports, invoices, contracts, and legal documents by binding templates to data from databases, XML, JSON, or custom objects. GroupDocs.Assembly for Python via .NET enhances productivity by eliminating manual document preparation and ensuring consistency across outputs. Its ability to handle conditional logic, loops, and data merging within templates provides flexibility for developers building enterprise-level automation workflows in Python while leveraging the .NET ecosystem.
GroupDocs.Assembly for Python via .NET is offered as Developer Small Business, Developer OEM, Site Small Business, and Site OEM licenses catering to a range of business needs. Licenses are perpetual, and include 1 year of support and maintenance. Subscription renewals are also available. See our GroupDocs.Assembly for Python via .NET licensing page for full details.
GroupDocs.Assembly for Python via .NET is available individually or as part of the following products:
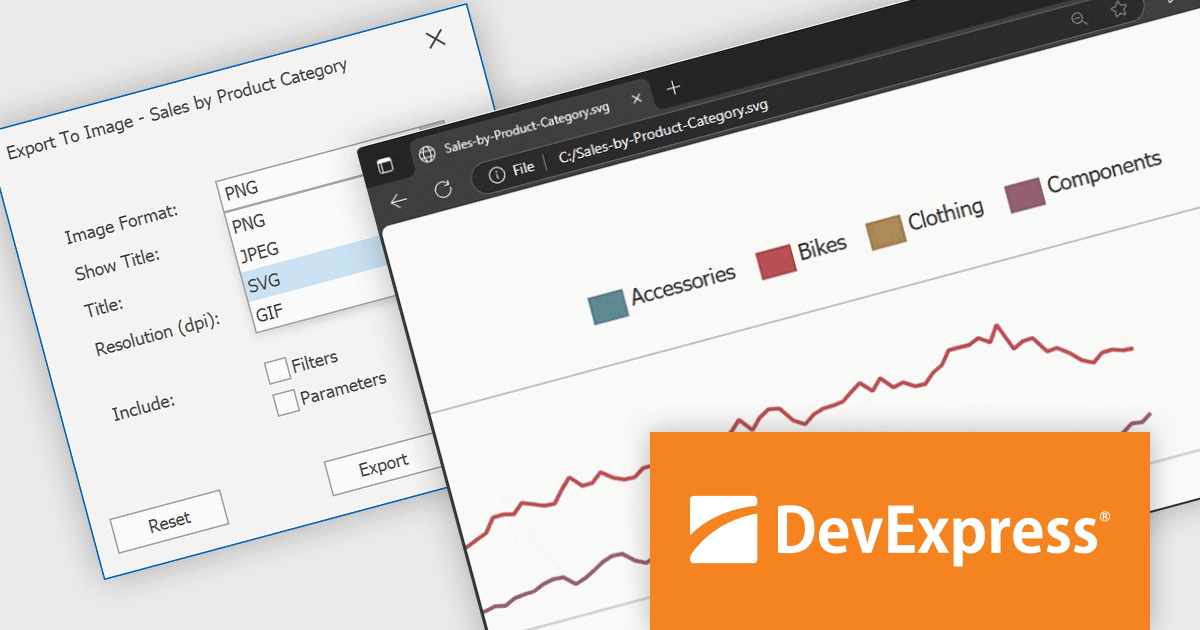
DevExpress BI Dashboard (part of DevExpress Universal) empowers you to craft interactive dashboards for desktop, web and mobile applications. It provides a visual designer for building dashboards without writing code, allowing you to drag-and-drop various data visualization widgets onto the canvas. These widgets connect to your data sources and update dynamically, offering real-time insights to end users. The tool also supports customization through properties and events, enabling you to tailor the look and feel of the dashboards to perfectly integrate with your application's design.
The DevExpress BI Dashboard v25.1 update adds support for exporting entire dashboards, specific items, or tab pages to Scalable Vector Graphics (SVG) format. This enhancement allows users and analysts to create resolution-independent, high-quality exports that maintain clarity at any size. SVG output is particularly useful for printed reports, shared presentations, or integration into documentation, where visual fidelity is essential.
To see a full list of what's new in version 25.1, see our release notes.
DevExpress BI Dashboard is included as part of DevExpress Universal which is licensed per developer and is available as a Perpetual License with a 12 month support and maintenance subscription. See our DevExpress Universal licensing page for full details.
DevExpress BI Dashboard is available in the following products:
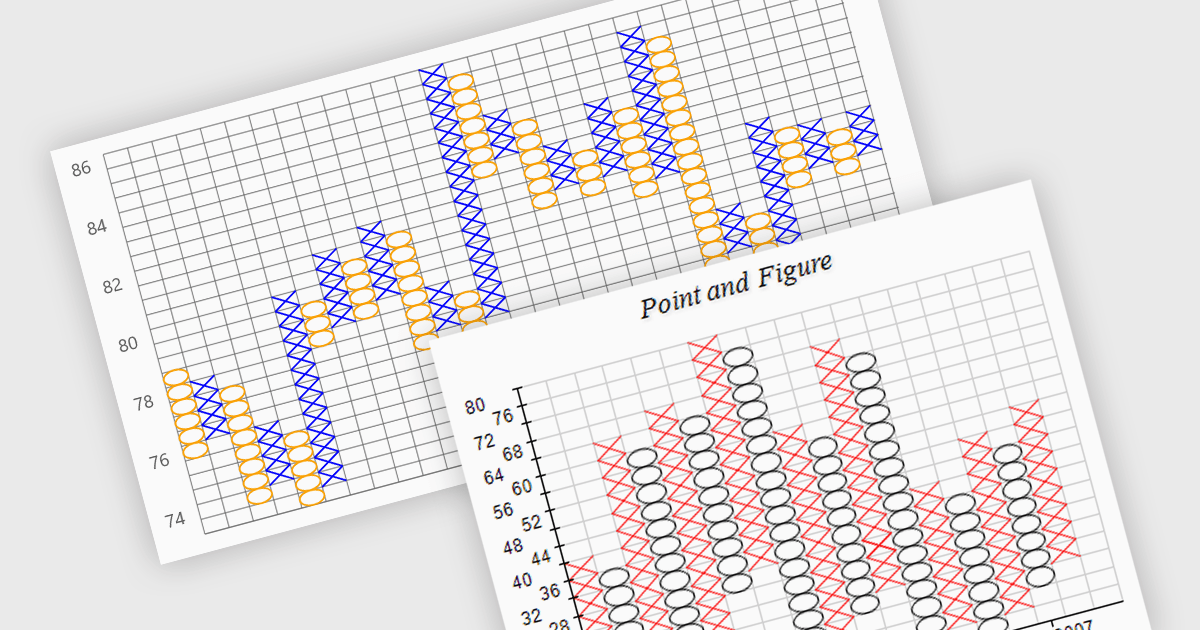
A point and figure (P&F) chart is a financial charting technique used to track price movements by plotting directional changes in price without reference to time. It focuses exclusively on significant price changes, filtering out minor fluctuations to highlight clear trends and reversals. Instead of plotting prices continuously, it uses columns of Xs and Os to represent rising and falling prices, respectively, based on predefined price increments. This chart type provides a straightforward view of supply and demand dynamics, making it particularly effective for identifying support and resistance levels, breakout patterns, and trend direction. Its simplicity helps traders and analysts focus on essential price action, reducing the noise found in traditional time-based charts.
Several .NET charting components provide you with point and figure charts, including:
For an in-depth analysis of features and price, visit our comparison of .NET chart components.
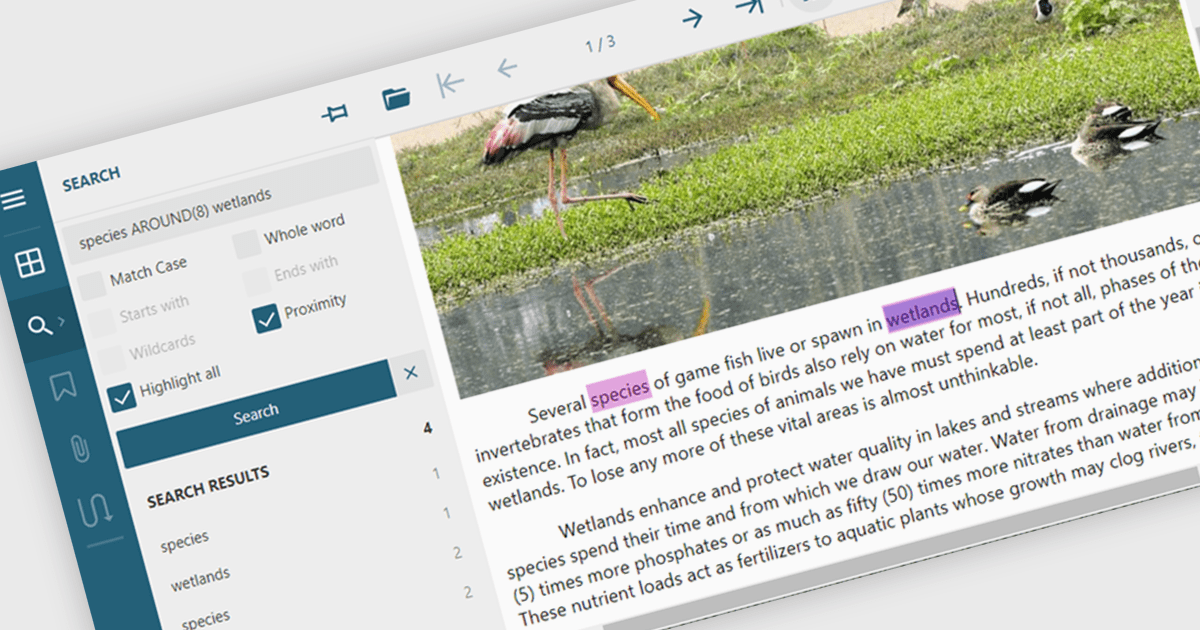
Text searching in a PDF component refers to the ability to programmatically locate and extract text within a PDF document based on specific search criteria. This functionality typically supports case sensitivity, whole word matching, and regular expressions, enabling precise querying across pages or document sections. For developers, it facilitates building features such as keyword highlighting, document indexing, content validation, and automated redaction workflows. By integrating text search, applications can efficiently interact with PDF content without manual review, saving time and improving data accessibility and accuracy across business and document automation systems.
Several ASP.NET Core PDF components allow you to search for text within a PDF file, including:
For an in-depth analysis of features and price, visit our comparison of ASP.NET Core PDF components.
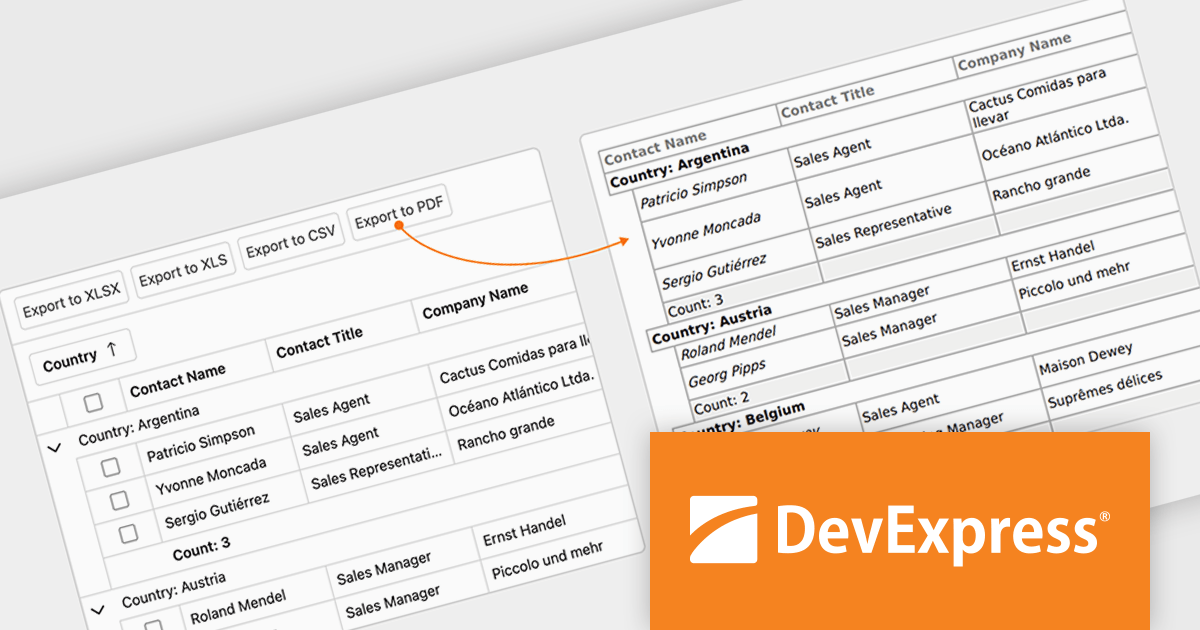
DevExpress Blazor (part of DevExpress ASP.NET and Blazor) helps you create high-impact user experiences for both Blazor Server and Blazor WebAssembly using C#. The Blazor UI Component Library ships with a comprehensive set of native components (including a DataGrid, Pivot Grid, Scheduler, Chart, Data Editors and Reporting).
The DevExpress Blazor v25.1 update enhances the Blazor Grid component with support for PDF export, allowing developers to generate documents that mirror the current data view. This includes all applied filters, sort orders, and group configurations, ensuring that the exported content matches the user's on-screen context. The PDF output retains data columns, group rows with summaries, and overall total summaries, making it a practical tool for sharing, archiving, or printing user-customized reports. This update helps developers deliver consistent, visually structured documents from within Blazor applications.
To see a full list of what's new in version 25.1, see our release notes.
DevExpress ASP.NET and Blazor is licensed per developer and is available as a Perpetual License with a 12 month support and maintenance subscription. See our DevExpress ASP.NET and Blazor licensing page for full details.
DevExpress Blazor is available in the following products:
電話: (888) 850 9911
Fax: +1 770 250 6199


