Architecture News

Handsontable が Angular 16 をサポート

9月 4, 2023
Angular の最新バージョンと Handsontable 13を使用し、強力でインタラクティブなデータ駆動型アプリケーションを作成

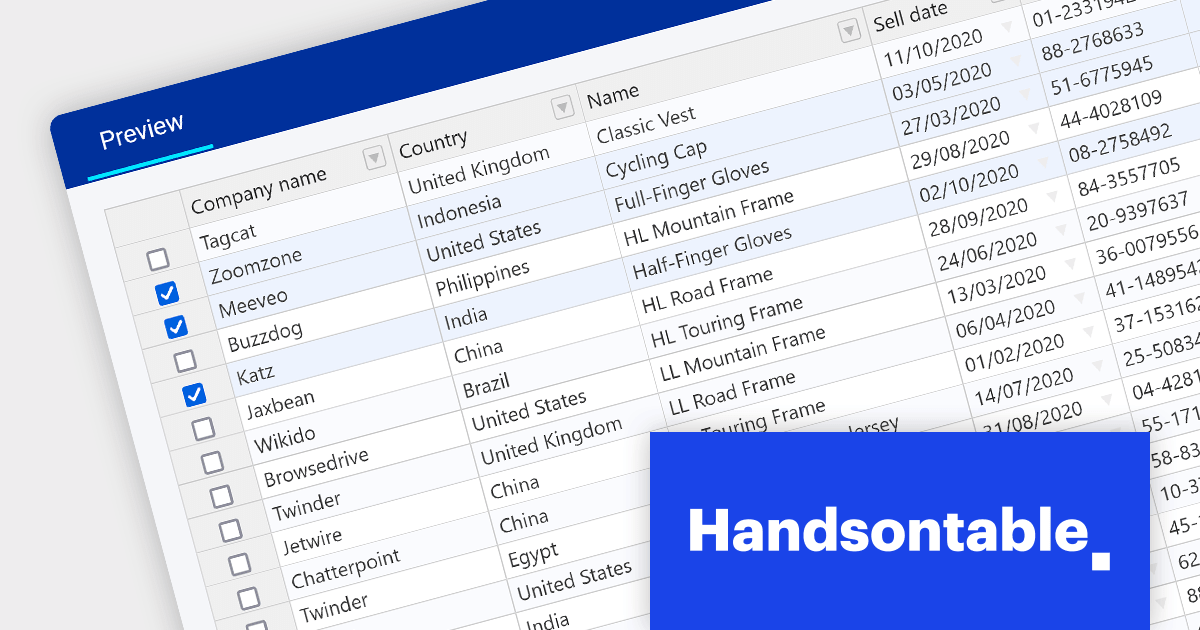
Handsontable is a JavaScript/HTML5 data grid component with a spreadsheet look-and-feel that is independent from any external framework. It can be easily modified or extended with custom plugins and comes with wrappers and directives for most popular frameworks, such as Angular, React and Vue.

Handsoncode has released version 13.0.0 of Handsontable, which adds support for Angular 16. The updated Angular wrapper now uses the Ivy compiler and follows Angular’s latest best practices. This release provides new Angular features, such as revamped reactivity, non-destructive hydration, and Angular Signals.

Version 13 also introduces a new frameworks-support policy, providing more transparency around which versions of frameworks are supported. This policy means that Handsontable will follow the support schedules of framework maintainers and provide 18 months of LTS for any dropped framework version, giving you peace of mind.

Support for Angular 16 in the new release of Handsontable, along with various bug fixes and performance improvements, makes it even easier to create modern Angular-based applications which support the latest features.

To see a full list of what’s new in version 13.0.0, see our release notes.

For more information, visit our Handsontable product page.

すべてのユーザーがAngularグラフを利用可能

8月 17, 2023
アクセシビリティ規格に準拠し、グラフの使いやすさを向上

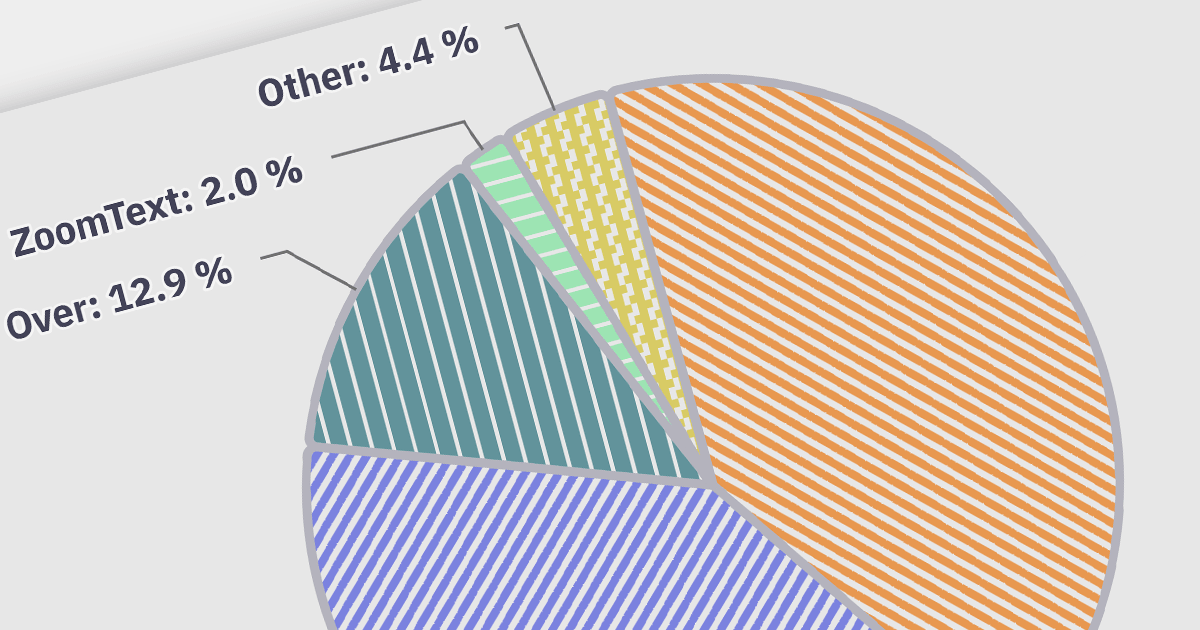
Accessibility features ensure that charts are usable by everyone, including people with disabilities. Examples include screen reader compatibility and keyboard navigation support. This ensures equal access to data visualizations, complying with accessibility standards, and enhancing user experience for all users.

Here is a selection of Angular charting components that provide accessibility features:

  • HighCharts Core is a powerful charting library that provides accessibility features like screen reader support, keyboard navigation, and customizable data labels.
  • AnyChart JS offers accessible charting solutions with features such as ARIA support, interactive tooltips, and focus highlighting for enhanced keyboard navigation.
  • amCharts 5: Charts comes with built-in accessibility options, making it easier to create inclusive charts by providing accessible descriptions, keyboard interaction, and visual cues for data points.

Many multi-function component suites also feature charting controls with accessibility support, including:

  • DevExtreme Chart (part of DevExtreme Complete) ensures accessible data visualizations with features including assistive technology compatibility and keyboard navigation.
  • Kendo UI for Angular Chart (part of Kendo UI) supports accessible charts through keyboard interaction, ARIA attributes, and other accessibility enhancements.
  • SmartClient offers accessibility support for its charting components, including accessible labels and keyboard navigation.

For an in-depth analysis of features and price, visit our comparison of Angular charts.

Compare Angular Charts

ツールバーによる ASP.NET アプリの拡張

8月 17, 2023
豊富な機能とカスタマイズされたツールバーを使用して、アプリケーションを簡単に移動

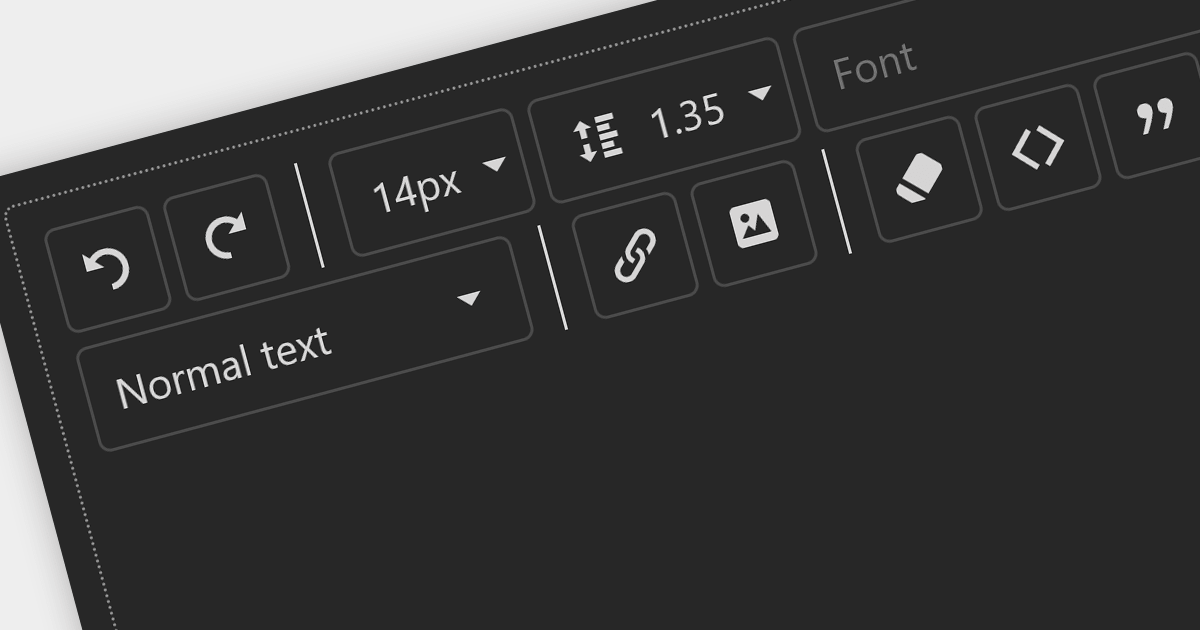
Toolbars are graphical user interface (GUI) elements that feature a curated selection of tools and functions that users commonly use. Adding a toolbar to your application allows users to speed up their workflow by providing all the tools they need in an easily accessible position within your application.

Here is a selection of ASP.NET UI suites that include toolbars:

  • DevExpress ASP.NET allows you to create intuitive and efficient ASP.NET user interfaces using a diverse range of customizable toolbar options.
  • Telerik DevCraft Ultimate lets you seamlessly integrate a variety of customizable toolbar elements, enhancing user experience.
  • Syncfusion Essential Studio Enterprise offers a range of dynamic ASP.NET toolbar controls. Quickly incorporate essential actions and functionalities into your Web applications.
  • WebUI Studio for ASP.NET (by Intersoft Solutions Corporation) includes interactive toolbar elements allowing you to tailor the appearance and behavior to meet your application's needs.

For an in-depth analysis of features and price, visit our comparison of ASP.NET user interface suites.

Compare ASP.NET UI Suites

XPath アナライザーによる構造化されたコンテンツの効率化

8月 11, 2023
XPath 分析機能を備えたツールを使用し、XPath 式をデバッグおよびテスト可能

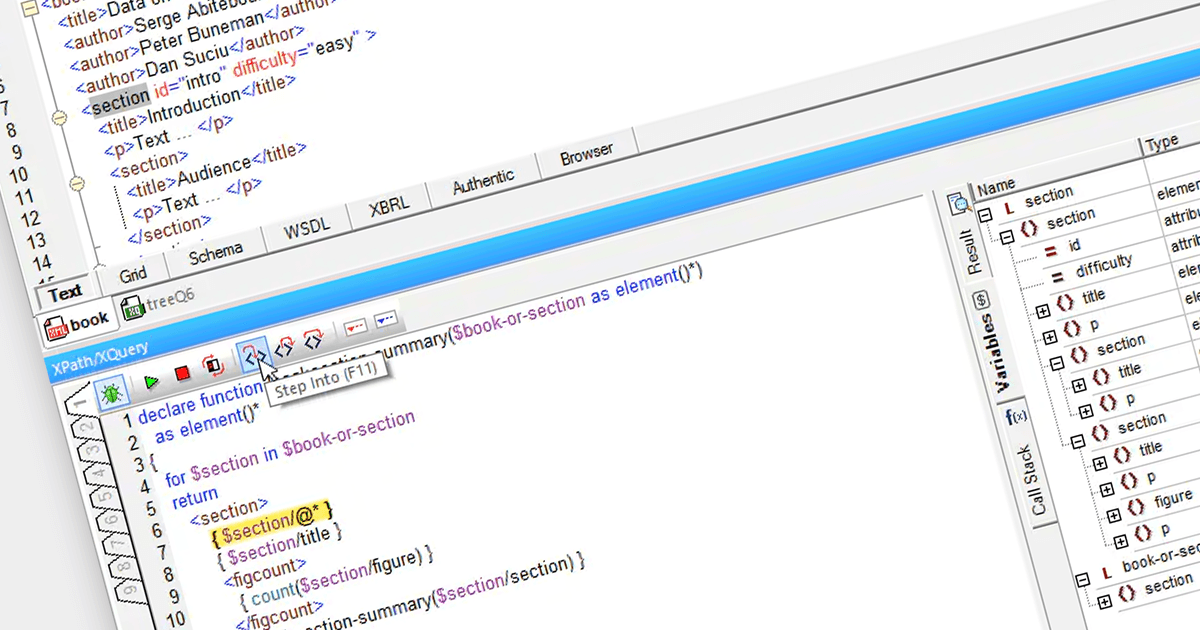
An XPath analyzer is a tool used for examining XML or HTML documents by interpreting XPath expressions. This enables streamlined data extraction and manipulation processes, proving particularly useful for tasks such as Web scraping, data mining, and XML parsing. By interpreting the specified XPath queries, the analyzer locates specific elements, attributes, or patterns within documents, contributing to efficient data retrieval and structured analysis.

Here are some XML tools that provide an XPath analyzer:

  • Altova XMLSpy Enterprise XML Editor features a dedicated XPath analyzer window, allowing users to input XPath expressions and evaluate results in real-time. Its user-friendly interface and debugging capabilities make it a powerful tool for developers and data analysts.
  • Oxygen XML Author Enterprise (by Syncro Soft) is another product with an XPath analyzer. It assists users in interpreting complex XPath expressions through an intuitive graphical interface, simplifying the process of querying and navigating XML content.
  • Stylus Studio XML Enterprise Suite offers an XPath analyzer which aids users in testing and fine-tuning XPath queries, ensuring accurate data retrieval from structured documents.

For an in-depth analysis of features and price, visit our comparison of structured document tools.

Compare Structured Document Tools

jQuery を使用したチャートの注釈付け

8月 10, 2023
重要なデータポイントと傾向を注釈で強調表示することで、グラフの分かりやすさを向上

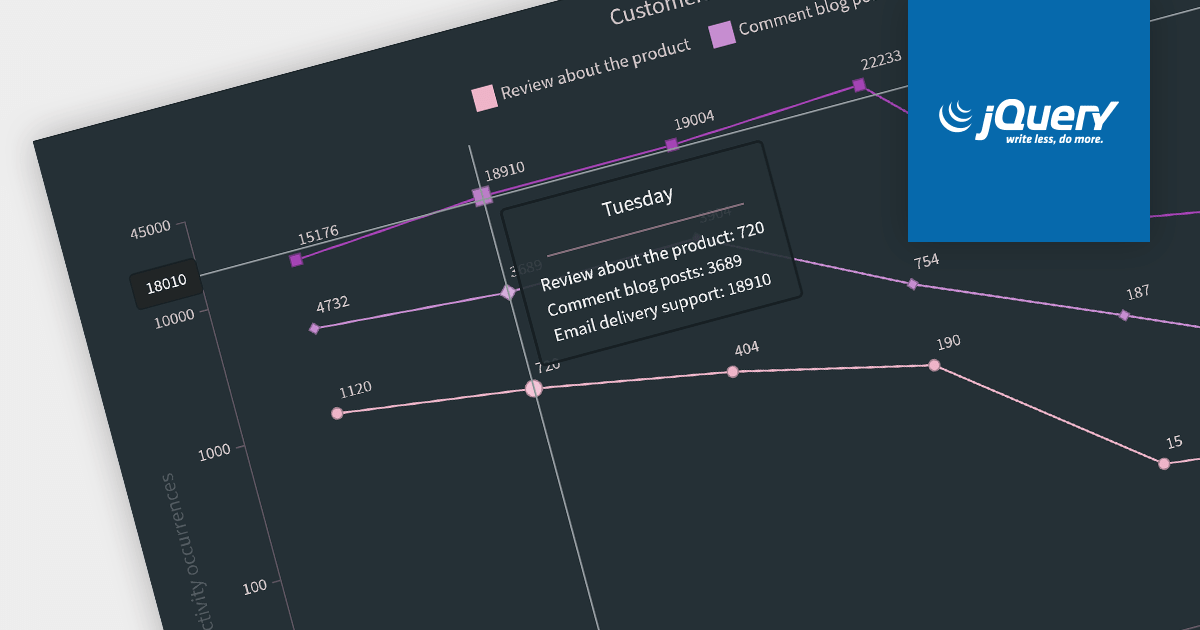
Chart annotation involves adding labels, markers, or other visual cues to data points on a chart. It enhances data visualization, providing context and insights to users, improving chart readability, and conveying information effectively.

Here is a selection of individual jQuery chart components that offer the ability to add annotations:

  • Highcharts Core (by Highsoft) allows you to create interactive charts by seamlessly incorporating annotations. Highlight key data points, create callouts, and draw shapes and lines to enhance your visualizations.
  • TeeChart JS (by Steema Software) offers versatile and extensive annotation support. Add context to your charts through text, images, custom HTML, and shapes, enhancing data interpretation.
  • AnyChart JS allows you to elevate your charts with a rich array of annotations. Emphasize trends using text, images, shapes, lines, and arrows, making your data-driven insights more impactful and interactive.
  • ZingChart provides various annotation options. From text and images to shapes and lines, annotations add depth to your visualizations, improving communication of insights.

Many multi-function component suites provide charting components with annotation support, including:

  • DevExtreme Chart (part of DevExtreme Complete by DevExpress) allows you to add annotations to charts that can be animated and interactive. Enrich your charts with text, images, shapes, and lines for dynamic data visualization.
  • Ignite UI jQuery Chart (part of Ignite UI by Infragistics) allows you to seamlessly incorporate annotations into your charts. Add text, images, shapes, and lines to communicate key insights, making your visualizations more engaging and informative.
  • Kendo UI for jQuery Chart (part of Kendo UI by Telerik) allows you to harness extensive customization options, including animated and interactive annotations. Enhance your charts with text, images, shapes, and lines, delivering data-driven insights effectively.
  • Syncfusion JavaScript Chart (part of Syncfusion Essential Studio Enterprise) offers versatile annotation features, such as customizable text, images, shapes, and lines.

For an in-depth analysis of features and price, visit our comparison of jQuery charts.

Compare jQuery Charts