


公式サプライヤー
公式および認定ディストリビューターとして200社以上の開発元から正規ライセンスを直接ご提供いたします。
当社のすべてのブランドをご覧ください。
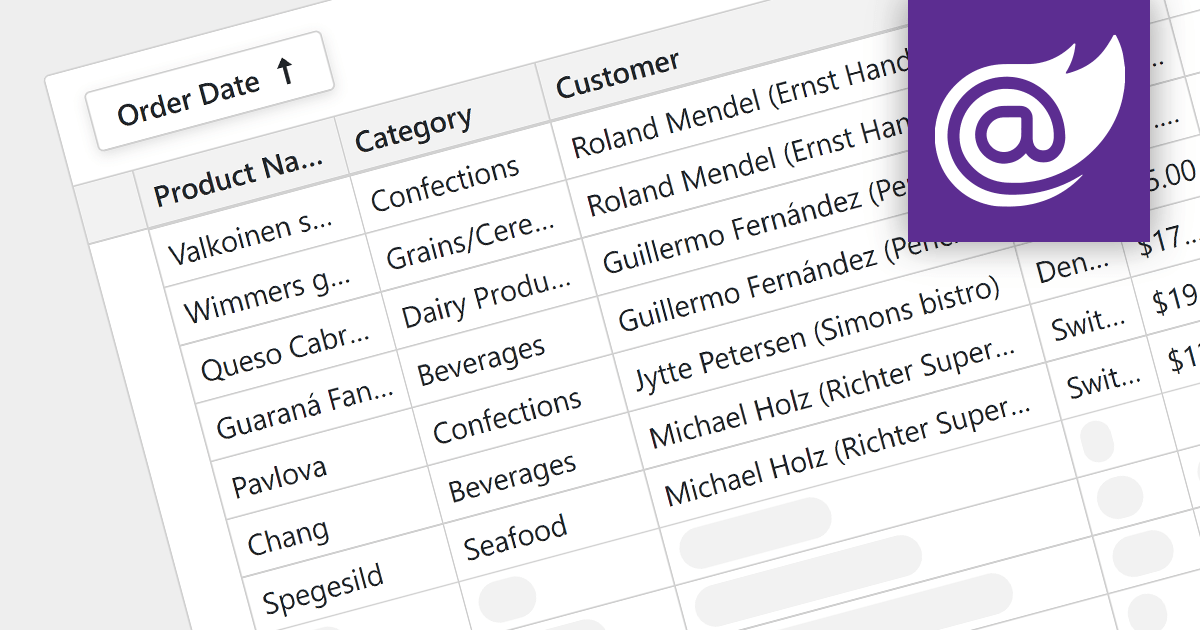
For large datasets, traditional grid scrolling struggles to maintain performance, often becoming sluggish and resource-intensive. Virtual scrolling provides a more efficient alternative. Instead of rendering the entire dataset at once, it dynamically fetches and displays only the visible rows, keeping the rest cached and unloaded. This significantly reduces the number of elements in the application, resulting in a noticeably smoother scrolling experience, even with millions of data points. Virtual scrolling empowers users to seamlessly explore expansive datasets without compromising performance or responsiveness.
Several Blazor grid components support virtual scrolling including:
For an in-depth analysis of features and price, visit our Blazor grids comparison.
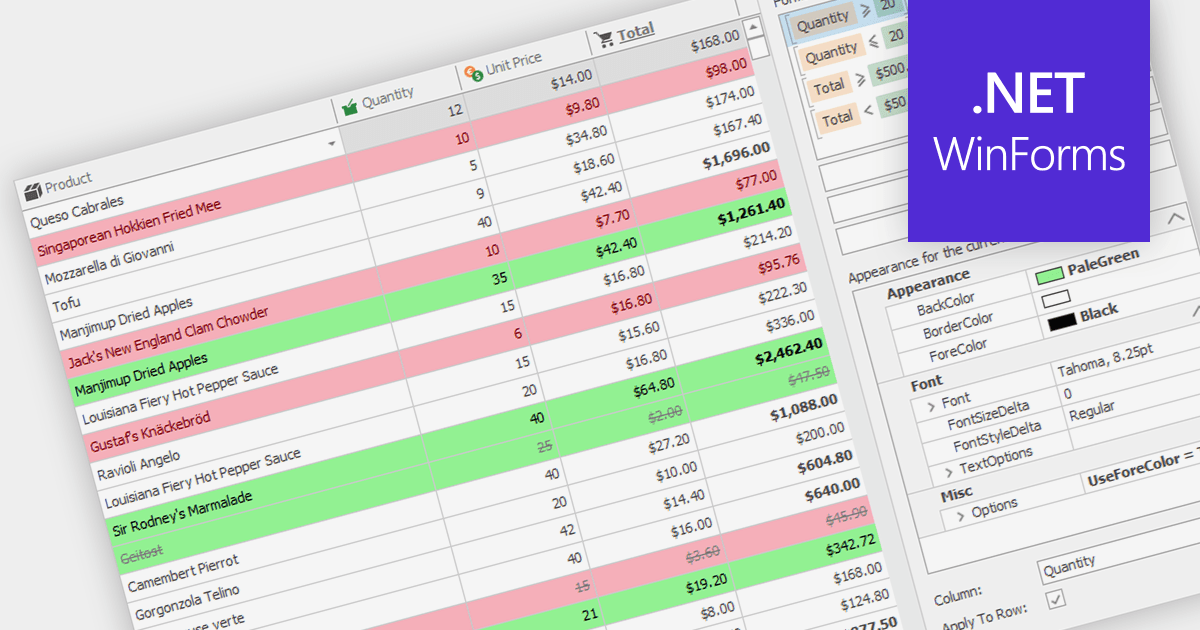
Conditional formatting in grids allows users to apply visual styles to cells or ranges based on the data they contain. It enhances data readability and analysis by highlighting critical values, outliers, or trends in a data-driven manner. For instance, a cell might be colored red if it contains a value below a certain threshold, thereby drawing attention to potential issues.
Several WinForms grid components support conditional formatting including:
For an in-depth analysis of features and price, visit our WinForms Grid comparison.

Handsontable is a JavaScript data grid component that provides a spreadsheet-like user experience for web applications. It allows developers to easily integrate data tables into their web pages, enabling users to manipulate data in a familiar and intuitive way.
Handsontable V14 now meets Web Content Accessibility Guidelines (WCAG) 2.1 AA standards, making it easier for people with disabilities to use the grid. This release also enhances screen reader compatibility by incorporating ARIA attributes into the HTML markup, ensuring seamless navigation for users of NVDA and JAWS on Windows, and VoiceOver on macOS.
To see a full list of what's new in version 14.0.0, see our release notes.
For more information, visit our Handsontable product page.
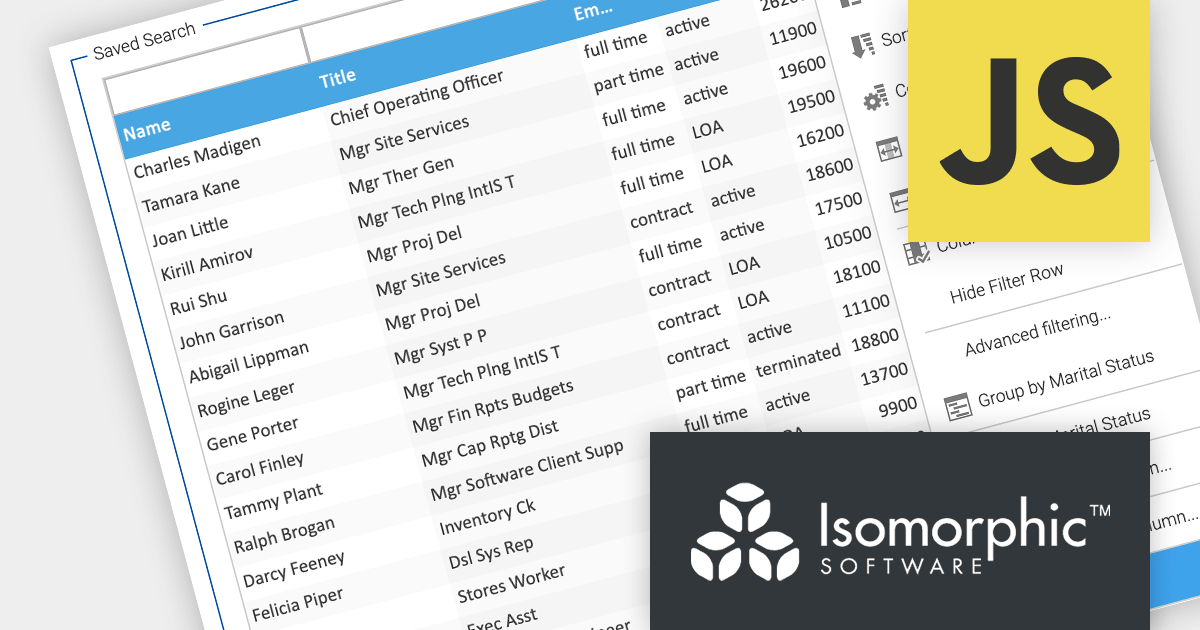
SmartClient is a comprehensive JavaScript component suite compatible with React, Vue, Angular, and more, that empowers you to craft large-scale, high-productivity Enterprise web applications. Its modern class system fosters clean encapsulation of application modules and screens, resulting in a more maintainable and comprehensible codebase.
In this blog post, Alex Fashakin demonstrates how to use SmartClient's built-in feature to save search preferences on grids. Steps include:
Read the complete blog to learn how to boost productivity with the SmartClient saved search feature.
For more information visit our SmartClient product page.
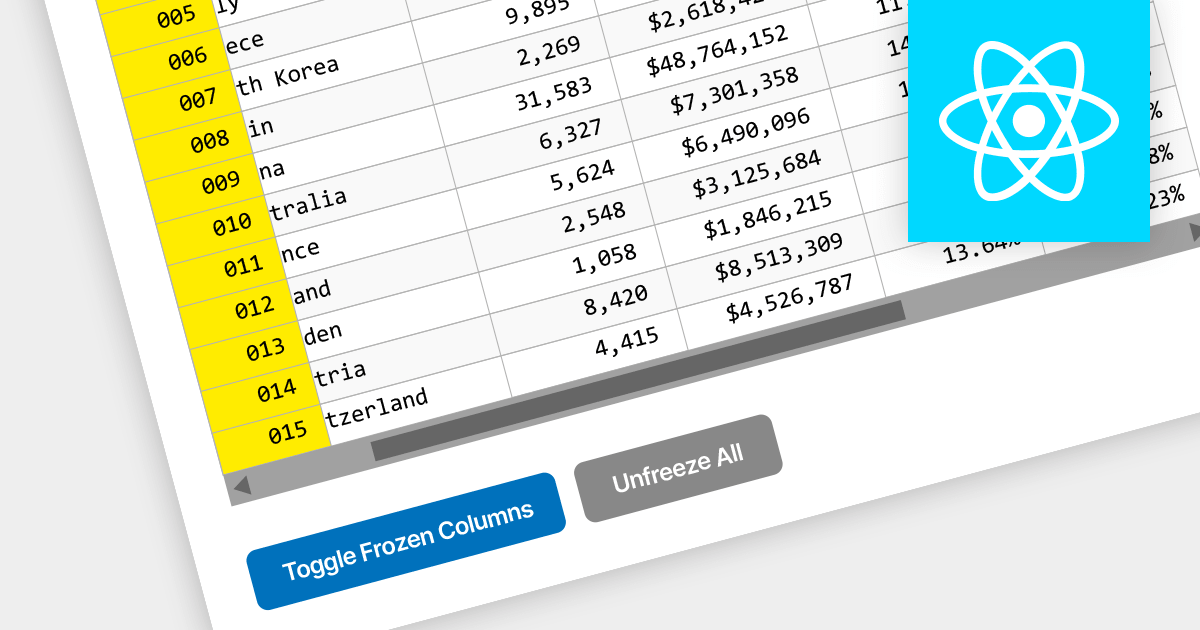
Locked column functionality (also known as frozen or pinned column) allows users to keep one or more columns static while scrolling horizontally through a grid. This is an essential feature for comparing data across a wide grid, ensuring that key information, such as a row identifier column, remains in view.
Several React grid components offer column freezing functionality including:
For an in-depth analysis of features and price, visit our comparison of React Grid components.
電話: (888) 850 9911
Fax: +1 770 250 6199


