


公式サプライヤー
公式および認定ディストリビューターとして200社以上の開発元から正規ライセンスを直接ご提供いたします。
当社のすべてのブランドをご覧ください。
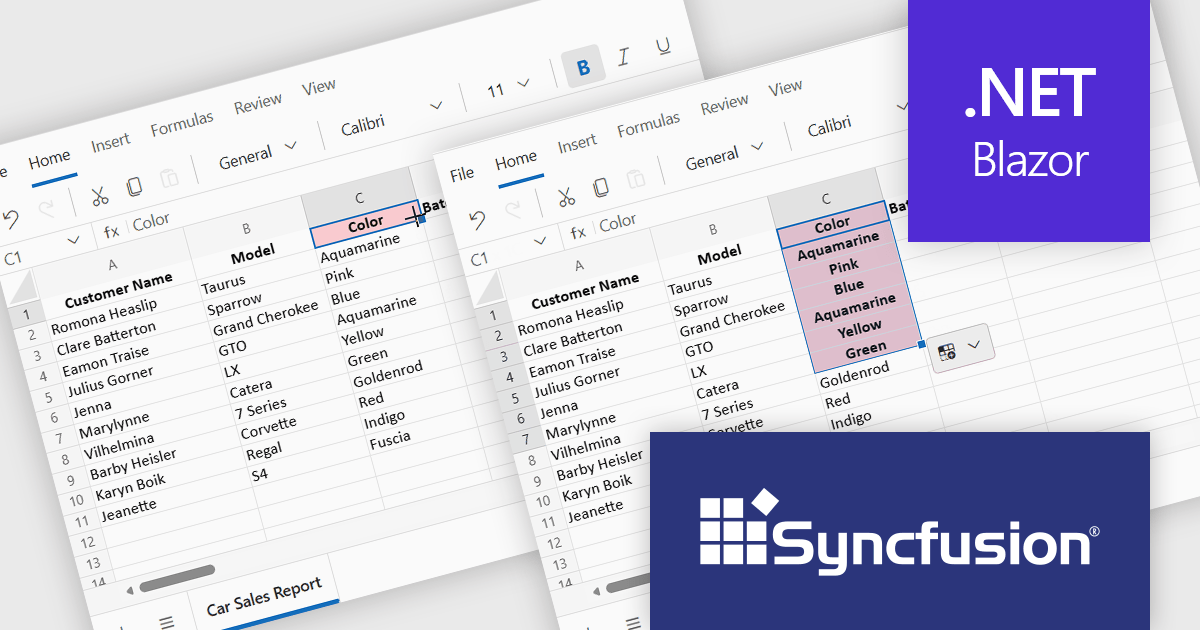
Syncfusion Essential Studio Spreadsheet Editor SDK is a library that lets developers embed spreadsheet functionality into web and desktop applications without requiring Microsoft Excel. It supports editing, formatting, and data analysis features such as cross sheet formula calculation, data binding to local and remote sources including JSON and REST, conditional cell styling, charts, data validation, worksheet protection, and workbook permissions. Available across frameworks including Blazor, React, Angular, Vue, JavaScript, ASP.NET Core and MVC, WPF, WinForms, and UWP, it helps teams deliver a familiar spreadsheet experience for use cases like reporting, budgeting, forecasting, and operational data entry directly within their applications.
The Syncfusion Essential Studio Spreadsheet Editor SDK 2025 Volume 4 update adds Blazor Autofill series support, allowing users to quickly extend numeric, date-based, and custom list patterns across cells in a predictable manner. This capability preserves existing cell formatting where applicable and provides flexible behavior for copying values versus generating sequences, reducing the need for custom implementation logic. As a result, developers can deliver more intuitive, Excel-like spreadsheet experiences with improved data consistency, reduced input errors, and faster interaction for end users.
To see a full list of what's new in Syncfusion Essential Studio Spreadsheet Editor SDK 2025 Volume 4 (32.1.19), see our release notes.
Syncfusion Essential Studio Spreadsheet Editor SDK is licensed per developer on a one year timed subscription basis, with runtime royalty free redistribution included when the subscription is current, and includes one year of unlimited technical support and updates. See our Syncfusion Essential Studio Spreadsheet Editor SDK licensing page for full details.
Learn more on our Syncfusion Essential Studio Spreadsheet Editor SDK product page.

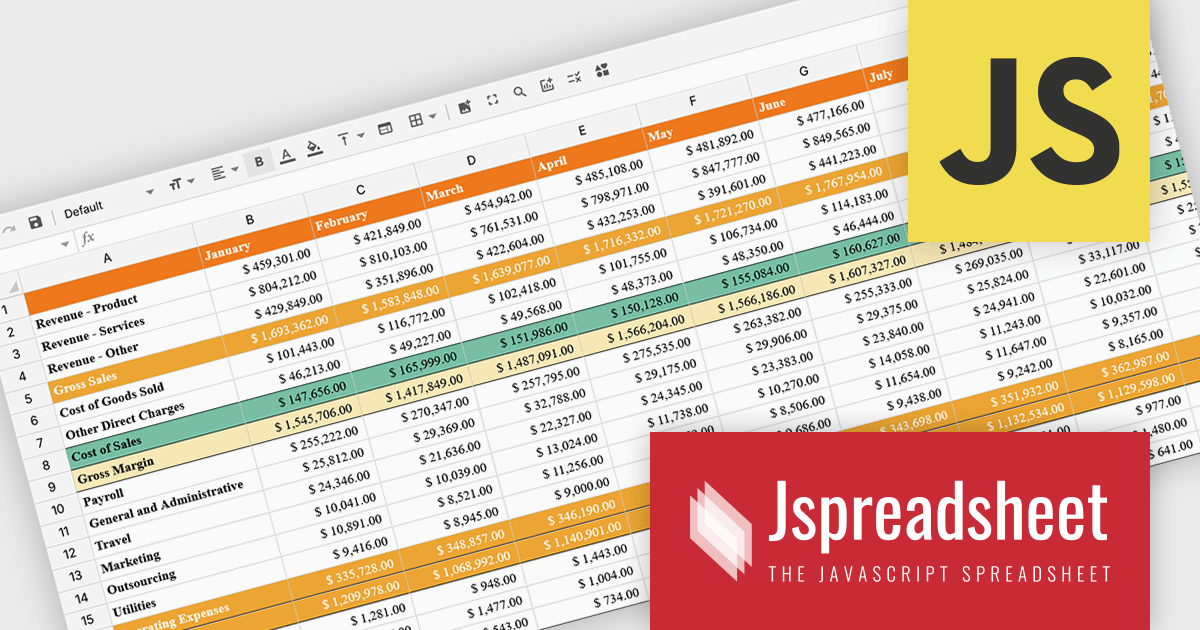
SpreadJS is a JavaScript spreadsheet and data visualization component built to deliver Excel-compatible functionality within web applications. It provides a flexible, high-performance interface for displaying and manipulating tabular data, supporting advanced features such as formulas, pivot tables, charts, conditional formatting, and data binding. SpreadJS integrates smoothly with popular frameworks like React, Angular, and Vue, and includes robust import and export capabilities for Microsoft Excel files. It is commonly used in enterprise applications where users need a responsive, interactive spreadsheet experience directly in the browser.
The SpreadJS 19.0.0 update introduces a new Collaboration Server Add‑on that enables real‑time, multi‑user editing of the same spreadsheet within web applications by integrating the collaboration framework and server infrastructure directly into SpreadJS. This add‑on lets developers build functionality where multiple clients see and apply changes instantly to workbook data with consistent state across users, supports conflict‑free concurrent edits using Operational Transformation logic, and includes features such as live user presence and permission controls.
To see a full list of what's new in 19.0.0, see our release notes.
SpreadJS is licensed per developer and includes 1 Year Maintenance (major and minor version releases and unlimited support phone calls). SpreadJS requires an Annual or Perpetual Deployment License. The optional Add-ons are available at an additional cost, and require a SpreadJS license. See our SpreadJS licensing page for full details.
For more information, visit our SpreadJS product page.
Jspreadsheet Pro is a flexible JavaScript-based spreadsheet solution that enables developers to create customizable, feature-rich data grids for web applications. It offers advanced formulas, data validation, and API integrations. Ideal for tasks like financial modeling, inventory management, and project tracking, it helps businesses efficiently manage and analyze data. Its backend server integration supports real-time data processing, enhancing workflows and boosting productivity across various industries.
The Jspreadsheet Pro v12 update improves handling of large datasets by introducing an extended viewport with optimized rendering that processes only the visible portion of the spreadsheet. This enhancement reduces memory usage, maintains interface responsiveness, and enables smooth interaction even when working with very large or complex data structures. It provides developers with a more scalable foundation for building applications that require high-performance spreadsheet capabilities without compromising speed or usability.
To see a full list of what's new in version 12, see our release notes.
Jspreadsheet Pro is licensed as an Annual or a Perpetual License with support and maintenance. We can supply any Jspreadsheet Pro license including new licenses, maintenance renewals, and upgrade licenses. See our Jspreadsheet Pro for full details.
For more information, visit our Jspreadsheet Pro product page.
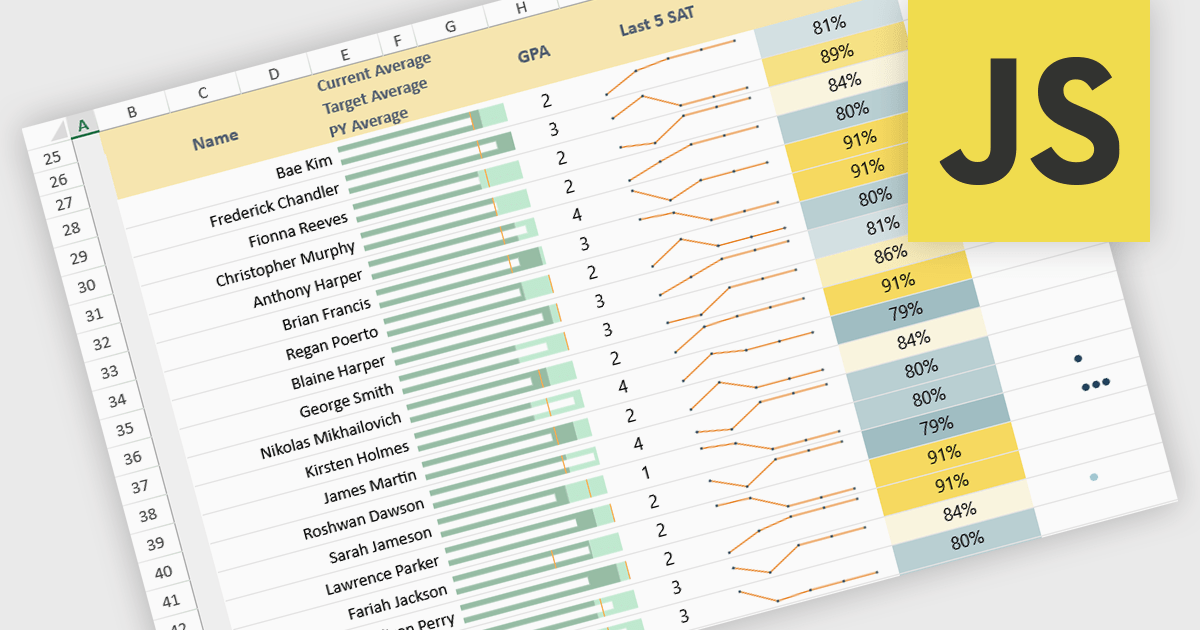
Sparklines in spreadsheets are small, in-cell charts that provide a concise visual summary of data trends without the need for full-sized graphs. They help users quickly identify patterns such as growth, decline, and volatility, making complex information easier to understand at a glance. Because sparklines update automatically with underlying data, they improve real-time analysis and are ideal for dashboards, performance tracking, and financial reporting. Common use cases include monitoring monthly sales performance, comparing product trends side by side, spotting anomalies in operational metrics, and enhancing executive summaries with clear, space-efficient visual context.
Several JavaScript spreadsheet controls offer sparkline functionality:
For an in-depth analysis of features and price, visit our comparison of JavaScript spreadsheet controls.
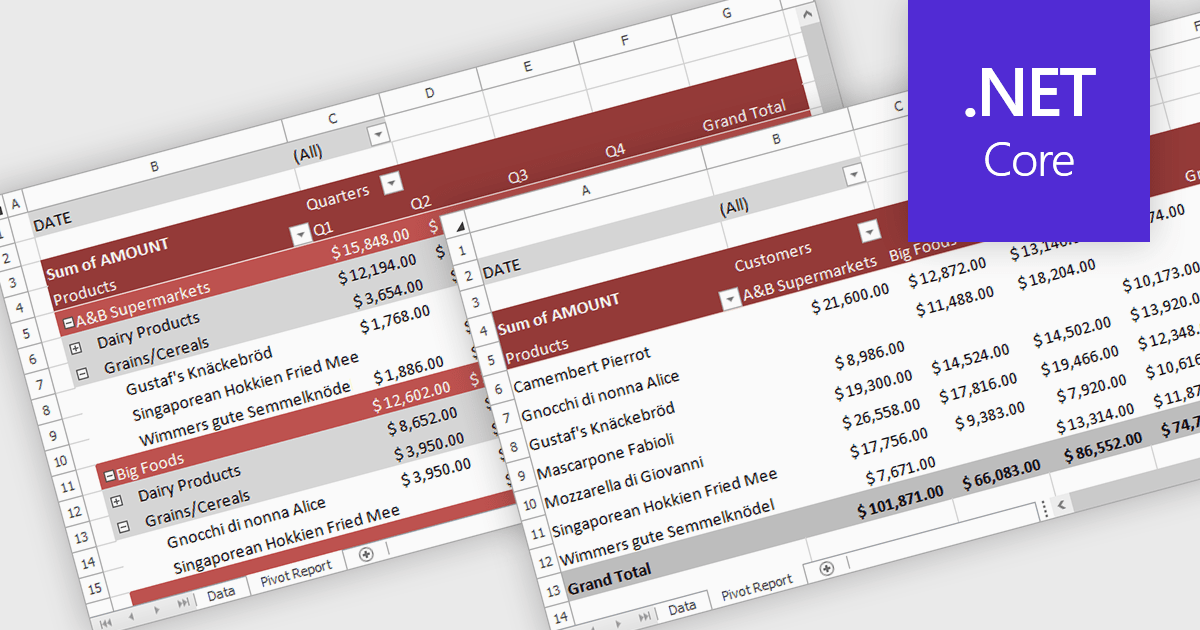
A pivot table in a spreadsheet lets you quickly summarize and explore large datasets by dynamically grouping, filtering, and aggregating data. It automatically calculates totals, averages, counts, and other metrics, reducing the need for complex formulas. This makes it easier to uncover trends, patterns, and outliers, such as comparing sales by region and product, analyzing costs by department, or tracking performance over time. By turning raw data into clear, interactive summaries, pivot tables help users make faster, more informed decisions.
Several .NET Core spreadsheet controls support pivot tables including:
For an in-depth analysis of features and price, visit our .NET Core spreadsheet controls comparison.
電話: (888) 850 9911
Fax: +1 770 250 6199


