


公式サプライヤー
公式および認定ディストリビューターとして200社以上の開発元から正規ライセンスを直接ご提供いたします。
当社のすべてのブランドをご覧ください。
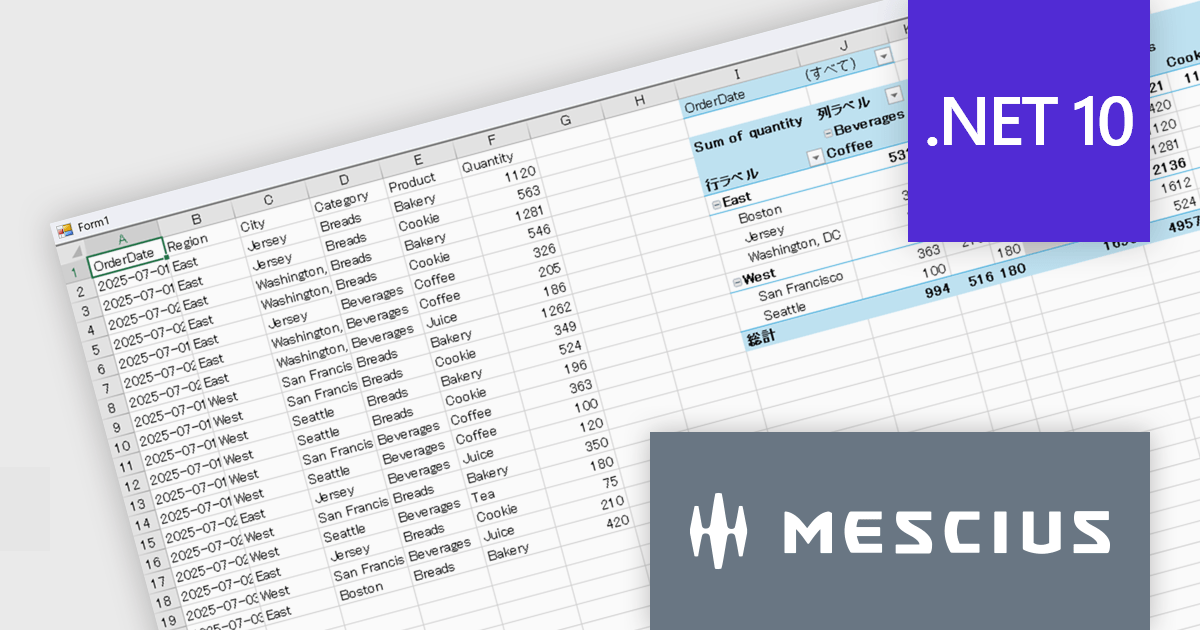
SPREAD for Windows Formsは、エンドユーザーにとって親しみのあるMicrosoft Excel®と互換性の高い表計算機能をアプリケーションに提供するコンポーネントです。
SPREAD for Windows Forms 19.0Jでは、最新の.NET 10およびVisual Studio 2026への対応により、最新の開発環境でWindows Formsアプリケーションを構築できるようになりました。これにより、パフォーマンス向上など最新プラットフォームのメリットを活用したアプリケーション開発が可能になります。
本バージョンではExcel互換機能も大きく強化されています。新たにピボットテーブル機能が追加され、単一テーブルのデータを多角的に集計・分析できるようになりました。マウス操作による直感的な操作でデータを整理できるため、専門的な関数知識がなくても効率的なデータ分析が行えます。さらに、新しい拡張チャート機能が追加され、折れ線チャートのスムージング、チャート下部へのデータテーブル表示、チャートスタイルの適用、データラベルや凡例テキストの向きのカスタマイズなど、グラフ表現の柔軟性が向上しました。
19.0Jでの新機能一覧は、リリースノートを参考ください。
本製品のライセンスは、開発者ごとに付与されるユーザーライセンスで、対象開発者は最大3台のマシンにインストール可能でで、ランタイムライセンスフリーです。なお、年間保守サービスが付属されており、無償バージョンアップや日本語によるE-mail技術サポートを無制限に受けることができます。詳細は、SPREAD for Windows Formsのライセンスページ をご参考ください。
SPREAD for Windows Formsの製品詳細及び販売情報は、SPREAD for Windows Forms(日本語版)ページをご参考ください。
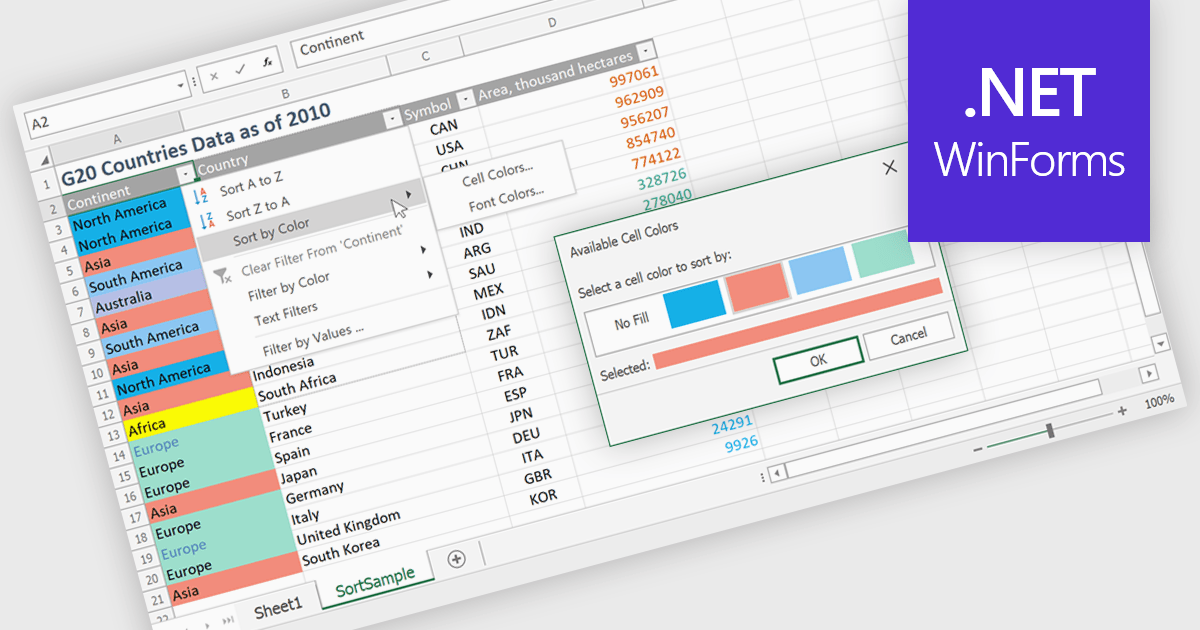
Data sorting in a spreadsheet is the process of arranging data in a specific order such as alphabetically, numerically, or by date based on one or more columns. It enables users and developers to quickly organize large datasets, improve readability, and surface meaningful insights such as top performing products, recent transactions, or lowest inventory levels. By supporting multi level sorting, for example by region and then by revenue, spreadsheets maintain row integrity while delivering structured and analysis ready views of data. Common use cases include ranking sales performance, organizing customer lists, managing financial records, preparing reports, and enhancing interactive data grids within business applications.
Several .NET WinForms spreadsheet controls allow you to sort data, including:
For an in-depth analysis of features and price, visit our comparison of .NET WinForms spreadsheet controls.

SpreadJS is a complete enterprise JavaScript spreadsheet solution used to create financial reports and dashboards, budgeting and forecasting models, scientific, engineering, healthcare, education, science lab notebooks, and other similar JavaScript business applications. It leverages a high-speed calculation engine with over 500 Excel built-in functions in 19 languages to deliver true Excel-like spreadsheet experiences with zero dependencies on Excel and full support for React, Vue, Angular, and TypeScript.
On Thursday, February 26th at 11:00 AM EST, MESCIUS (formerly GrapeCity) will be presenting a CodeClinic Live Webinar highlighting the new Collaboration Server as a production-ready solution for real-time, multi-user spreadsheet editing in enterprise JavaScript applications. During this webinar, SpreadJS Product Manager Chris Bannon and Product Marketing Manager Mackenzie Albitz will take you through the following key takeaways:
Register for the Live Webinar today and mark your calendar for February 26th.
SpreadJS is licensed per developer and includes 1 Year Maintenance (major and minor version releases and unlimited support phone calls). SpreadJS requires an Annual or Perpetual Deployment License. The optional Add-ons are available at an additional cost, and require a SpreadJS license. See our SpreadJS licensing page for full details.
For more information, visit our SpreadJS product page.
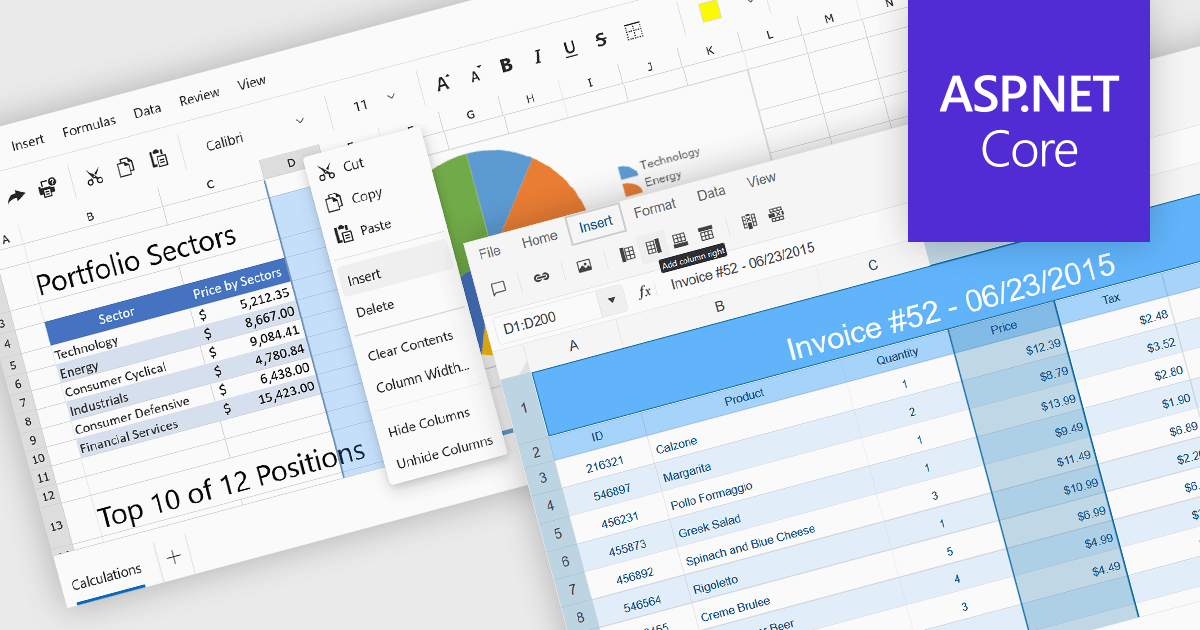
Inserting columns in a spreadsheet allows users to expand worksheets dynamically while preserving existing data and formulas. This capability is essential for scenarios where datasets evolve over time, such as adding new fields, categories, or calculated values. A well-implemented insert columns feature ensures that cell references, formatting, and formulas adjust automatically, helping maintain data integrity and reducing the risk of errors during updates.
Several ASP.NET Core spreadsheet controls offer the ability to insert columns including:
For an in-depth analysis of features and price, visit our ASP.NET Core spreadsheet controls comparison.
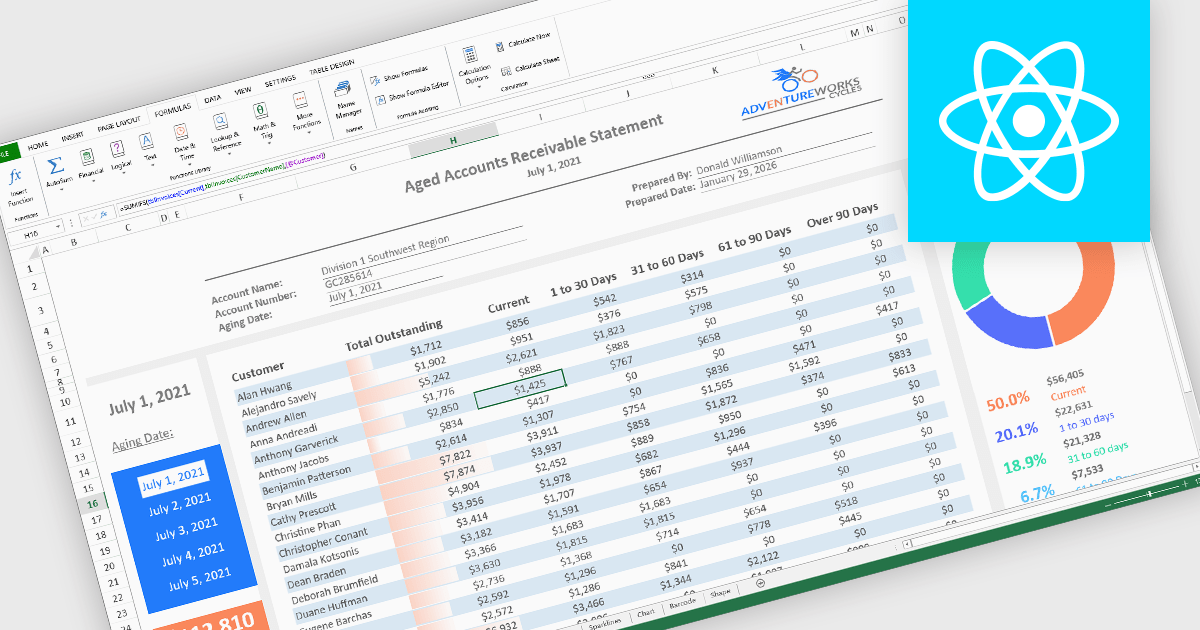
Formulas, calculations, and logic features form the analytical core of spreadsheet components, enabling data to be transformed into meaningful insights. These capabilities allow spreadsheets to move beyond static data entry by supporting dynamic calculations, rule-based behavior, and real-time feedback as data changes. A robust implementation ensures accuracy, consistency, and performance, making spreadsheets suitable for everything from simple models to complex, enterprise-grade analytical scenarios.
Common features include:
For an in-depth analysis of features and price, visit our React spreadsheet components comparison.
電話: (888) 850 9911
Fax: +1 770 250 6199


