


公式サプライヤー
公式および認定ディストリビューターとして200社以上の開発元から正規ライセンスを直接ご提供いたします。
当社のすべてのブランドをご覧ください。
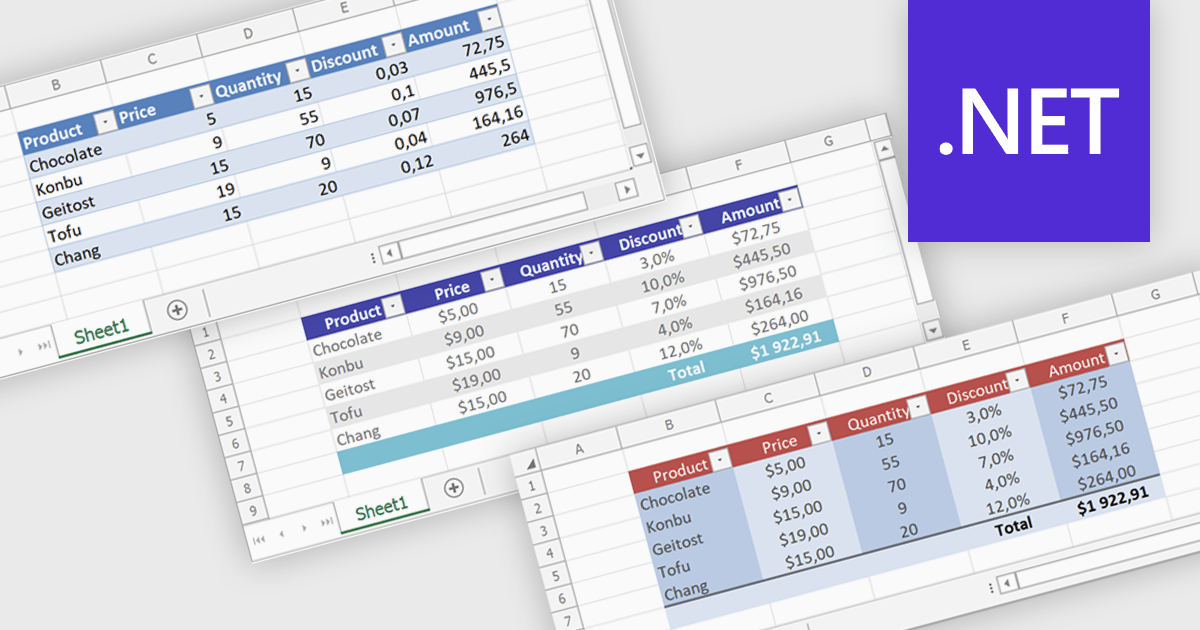
Spreadsheet tables provide a structured way to organize and manage data by grouping related information into defined rows and columns with built in functionality. They enhance usability by enabling automatic sorting and filtering, consistent formula application through calculated columns, and clearer data interpretation with structured references and styling. Tables can also expand dynamically as new data is added, reducing manual updates and errors. Common use cases include managing financial records, analyzing sales performance, tracking inventory, and working with data bound to external sources, making them a powerful tool for both everyday tasks and advanced data analysis.
Several .NET spreadsheet controls offer table support including:
For an in-depth analysis of features and price, visit our .NET spreadsheet controls comparison.
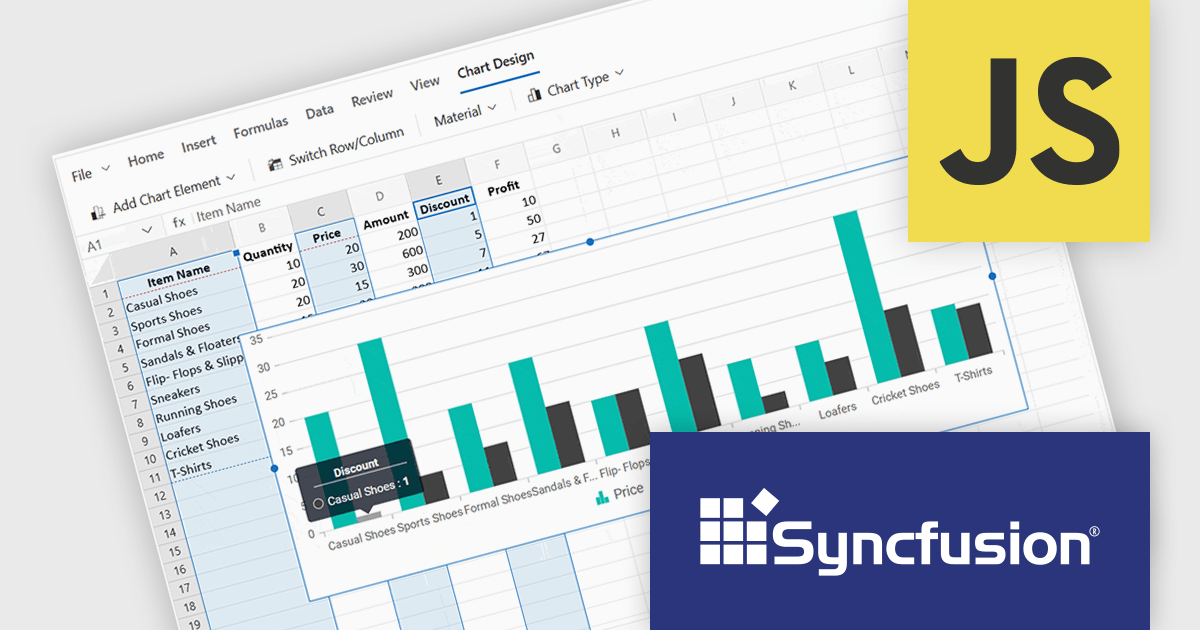
Syncfusion Essential Studio Spreadsheet Editor SDK is a library that lets developers embed spreadsheet functionality into web and desktop applications without requiring Microsoft Excel. It supports editing, formatting, and data analysis features such as cross sheet formula calculation, data binding to local and remote sources including JSON and REST, conditional cell styling, charts, data validation, worksheet protection, and workbook permissions. Available across frameworks including Blazor, React, Angular, Vue, JavaScript, ASP.NET Core and MVC, WPF and WinForms, it helps teams deliver a familiar spreadsheet experience for use cases like reporting, budgeting, and forecasting directly within their applications.
The Syncfusion Essential Studio Spreadsheet Editor SDK 2026 Volume 1 update introduces discontinuous chart range support, enabling developers to create charts from multiple non-adjacent rows, columns, or cell ranges without modifying the original data structure. This capability provides greater flexibility when working with complex, fragmented, or selectively relevant datasets, eliminating the need for manual data consolidation or duplication. It also ensures that charts remain automatically synchronized with updates across all referenced ranges, supporting more accurate, efficient, and maintainable data visualization within modern web and enterprise applications.
To see a full list of what's new in Syncfusion Essential Studio Spreadsheet Editor SDK 2026 Volume 1 (33.1.45), see our release notes.
Syncfusion Essential Studio Spreadsheet Editor SDK is licensed per developer on a one year timed subscription basis, with runtime royalty free redistribution included when the subscription is current, and includes one year of unlimited technical support and updates. See our Syncfusion Essential Studio Spreadsheet Editor SDK licensing page for full details.
Learn more on our Syncfusion Essential Studio Spreadsheet Editor SDK product page.
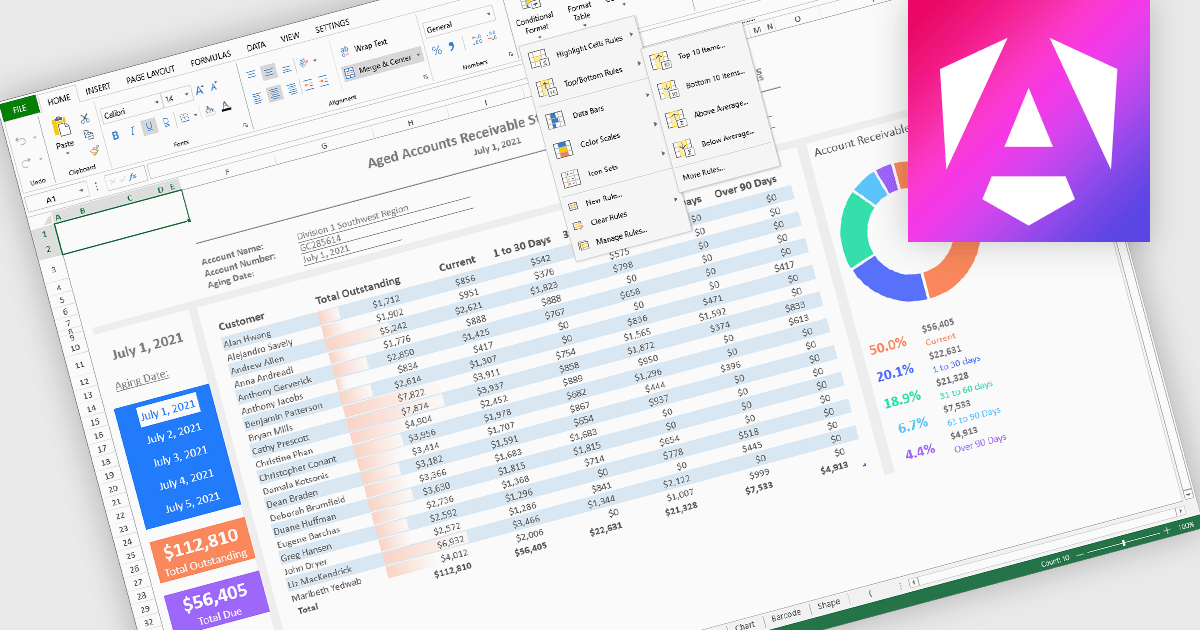
Conditional formatting in spreadsheet components allows developers to dynamically change the appearance of cells based on their values or defined rules. This feature helps highlight important data points, trends, and exceptions without requiring manual updates, making it easier for users to interpret large datasets at a glance. By applying visual cues such as colors, icons, and data bars, conditional formatting enhances readability and supports faster, more informed decision-making within spreadsheet-driven applications.
Several Angular spreadsheet controls offer support for conditional formatting including:
For an in-depth analysis of features and price, visit our Angular spreadsheet controls comparison.
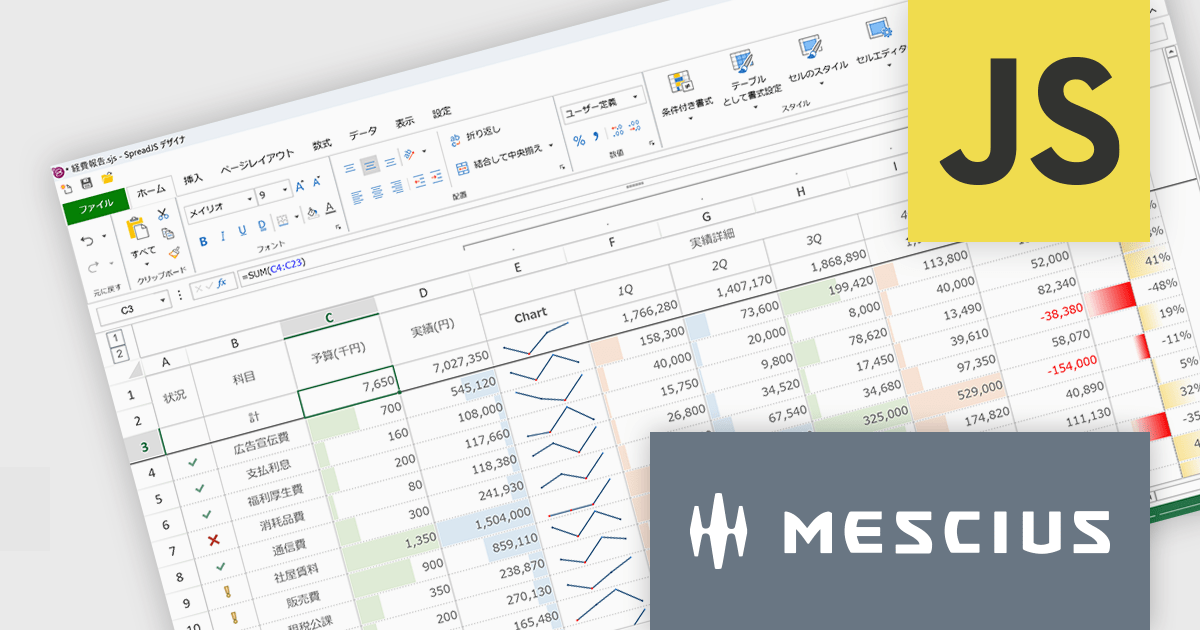
SpreadJSはWebアプリケーションでMicrosoft ExcelライクなUIと機能性を実現するために開発されたJavaScriptライブラリです。多数のExcel互換機能を備えるほか、TypeScriptでの開発や、Angular、React、Vue.jsをはじめとする主要JavaScriptフレームワークにも対応しています。付属するGUIデザイナもExcelに類似しているため、各種外観スタイルを直感的に操作できます。多くのコード量が必要な設定もノンコーディングで実現し、開発工数を大幅に削減します。
SpreadJS V19Jでは、各種AIプラットフォームのAPIと連携する機能が追加され、表計算環境におけるデータ活用が大きく進化しております。これにより、従来のように複雑な関数を扱うことなく、自然言語による指示でデータ分析や加工を実行できるようになっております。新たに追加されたAI関数として、AIへクエリを送信して分析を行う機能や、多言語翻訳、テキストの感情分析を行う機能が提供されております。これにより、従来は手作業で行っていた分析業務の効率化が可能となっております。また、数式エディタにもAI機能が組み込まれており、自然言語から数式を自動生成できるほか、作成した数式の内容を解析して説明を取得することが可能です。複雑なロジックの理解や保守性向上にも寄与いたします。
これらの機能により、SpreadJSは従来の表計算ツールから、AIと連携した高度なデータ分析基盤へと進化しており、さまざまな業務シーンでの活用が期待されます。
V19Jでの新機能一覧は、リリースノートを参考ください。
SpreadJSのライセンスは、開発ライセンスや配布ライセンス、テスト配布ライセンスなどの種類があります。なお、各ライセンスに付属されているサブスクリプション(1年間)にはテクニカルサポートや無償アップグレード等のサービスが提供されます。詳細は、SpreadJS(日本語版)のライセンス をご参考ください。
製品詳細及び販売情報は、SpreadJS(日本語版)のページをご参考ください。
Spread.NET helps you create spreadsheets, grids, dashboards, and forms. It includes a powerful calculation engine with 450+ functions and the ability to import and export Excel spreadsheets. Leverage the extensive .NET spreadsheet API and powerful calculation engine to create analysis, budgeting, dashboard, data collection and management, scientific, and financial applications.
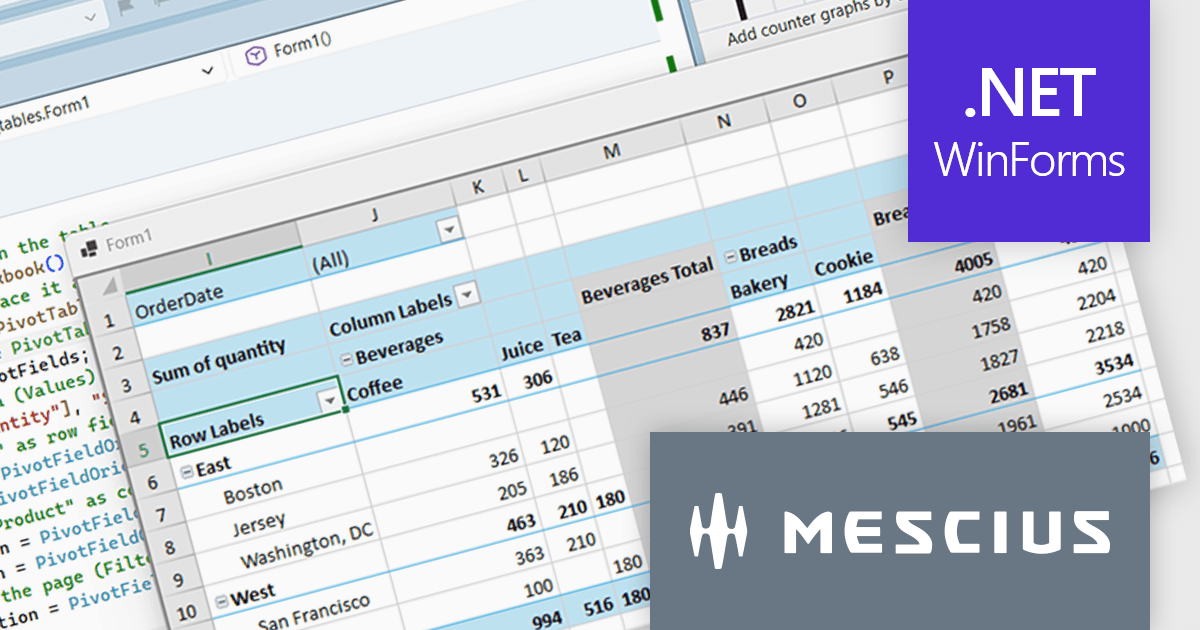
In this blog post, MESCIUS Product Marketing Specialist Mackenzie Albitz demonstrates how to build a Pivot Table using the Spread.NET WinForms component, enabling your users to quickly analyze large datasets with the ability to summarize, group, and reorganize data. Creating the Pivot Table includes the following steps:
Detailed source code and sample data are included to assist you along the way.
Read the complete blog post to learn how to integrate a spreadsheet component into your .NET applications and provide your users with familiar spreadsheet functionality without referring them to an external program.
Spread.NET is licensed per developer and is available as either a Perpetual or Annual license, depending upon geographic location. We can supply any Spread.NET license including new licenses, maintenance renewals, and upgrade licenses. See our Spread.NET licensing page for full details.
For more information, visit our Spread.NET product page.
電話: (888) 850 9911
Fax: +1 770 250 6199


