


公式サプライヤー
公式および認定ディストリビューターとして200社以上の開発元から正規ライセンスを直接ご提供いたします。
当社のすべてのブランドをご覧ください。
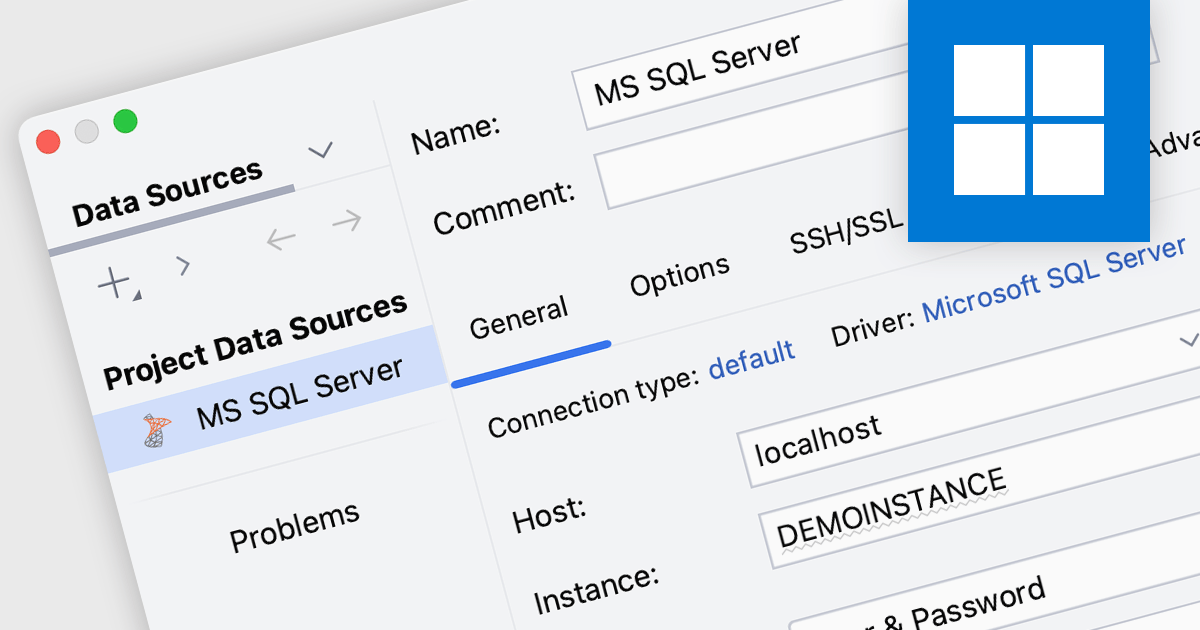
SQL Server connectivity in integrated development environments (IDEs) allows developers to connect directly to an SQL Server database, enabling them to execute queries, manage data, and interact with database objects like tables and stored procedures within the IDE. This integration streamlines workflows by reducing the need to switch tools, enhances productivity with features like autocomplete and syntax highlighting, and supports better collaboration and database management through visual tools and intuitive interfaces. It also simplifies debugging, testing, and schema visualization, making development more efficient.
Many integrated development environments (IDEs) offer SQL Server connectivity including:
For an in-depth analysis of features and price, visit our comparison of IDEs.
ComponentSource and Softbuilder have enjoyed a successful five year partnership focused on delivering high-quality database management and data modeling solutions to the global developer community. This enduring collaboration highlights their mutual dedication to equipping developers with tools that boost productivity and simplify workflows.
Softbuilder is a software development company that provides cutting-edge tools designed to streamline database management, enhance data modeling, and optimize the handling of complex metadata. With a focus on delivering user-friendly, efficient, and innovative solutions, the company serves a wide range of industries and technical needs. Its products empower professionals to improve workflows, maintain data integrity, and meet the demands of modern database systems with precision and reliability. By combining expertise with a commitment to quality, Softbuilder stands out as a trusted partner for businesses seeking to elevate their data-driven operations.
ComponentSource, a leading distributor of software components and development tools, has played a crucial role in expanding the reach of the Softbuilder range. Through this partnership, ComponentSource has helped make AbstraLinx, ERBuilder Data Modeler, and other Softbuilder products accessible to a broader audience of developers.
The enduring collaboration between ComponentSource and Softbuilder has had a positive impact on the developer community by making powerful database and data modeling tools more accessible. As we celebrate this five year partnership, we look forward to strengthening our relationship and continuing to provide developers worldwide with reliable, innovative solutions that enhance their workflows.
Learn more about Softbuilder.
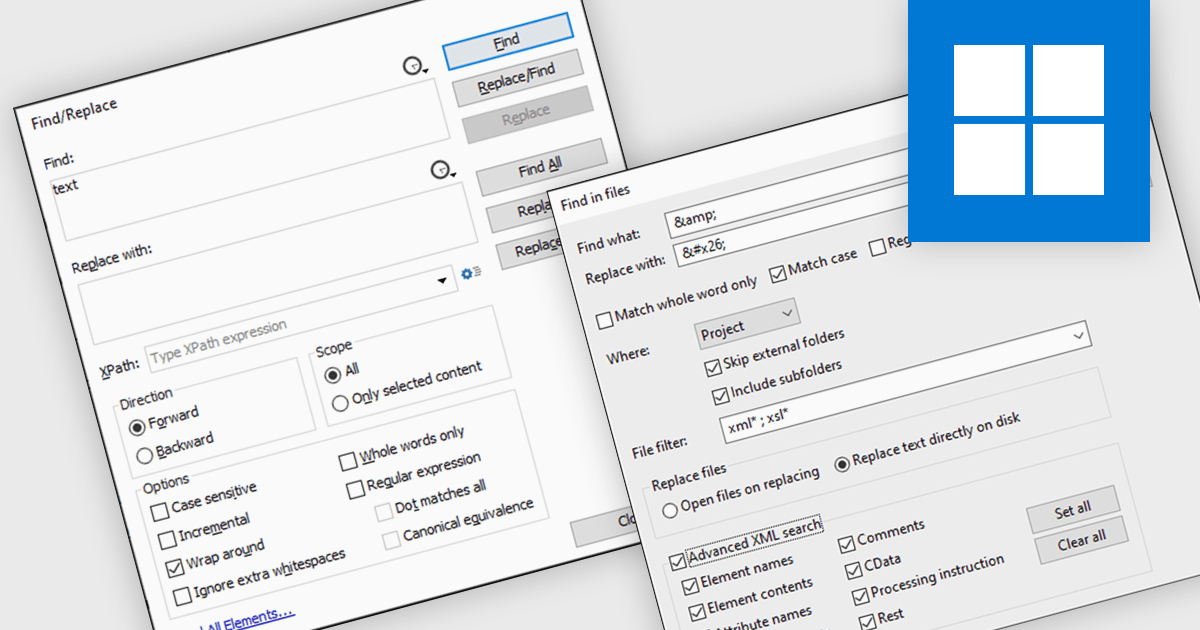
Find and replace functionality in XML tools allows users to efficiently locate specific elements, attributes, or values within XML documents and modify them in bulk with precision. This feature is invaluable for maintaining consistency, updating outdated content, or correcting errors across large or complex XML files. By automating repetitive tasks, it saves time, reduces the likelihood of manual errors, and enhances productivity. Common use cases include updating metadata, restructuring tags, or applying global changes to data schemas. Whether managing extensive content libraries or refining XML for data exchange, find and replace is an essential tool for streamlining workflows and ensuring accuracy.
Several structured document tools offer find and replace including:
For an in-depth analysis of features and price, visit our structured document tools comparison.
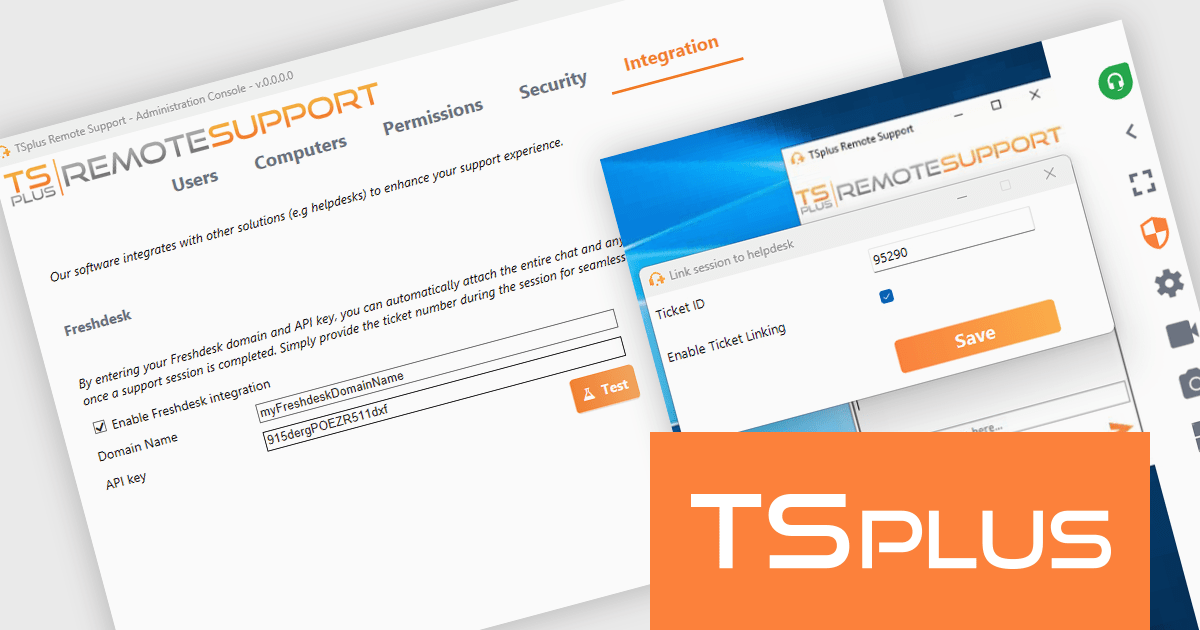
TSplus Remote Support is a secure and user-friendly solution for remote troubleshooting and customer support. It enables real-time connections to resolve technical issues efficiently. Version 3.90 introduces Freshdesk integration, linking support sessions to tickets while automatically attaching chat history, files, and system details. This streamlines workflows, improves ticket organization, and reduces administrative tasks. Ideal for IT teams and service providers, TSplus Remote Support enhances support quality and operational efficiency.
The TSplus Remote Support version 3.90 update introduces full Freshdesk integration, enabling developers to streamline support workflows by connecting remote support sessions directly to Freshdesk tickets. This integration automates the collection and attachment of session data, including chat history, uploaded files, and system details, as private notes within the relevant ticket. Consolidating critical information in one platform reduces manual overhead, ensures precise documentation, and enhances collaboration across teams. This update empowers developers to build more efficient support processes, improve data accessibility, and deliver higher-quality support experiences within their applications.
To see a full list of what’s new in version 3.90, see our release notes.
TSplus Remote Support is licensed per concurrent connection. Licenses include a 1 year subscription for updates and support. See our TSplus Remote Support licensing page for full details.
For more information, visit our TSplus Remote Support product page.
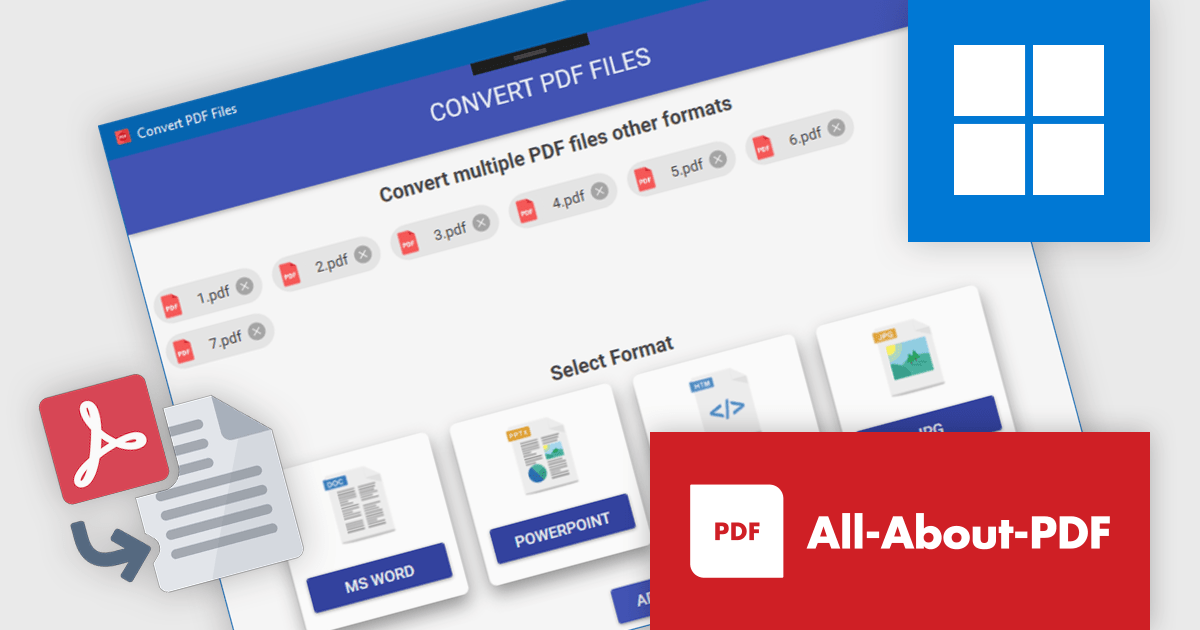
All-About-PDF is a versatile PDF management solution designed to simplify and enhance how users handle PDF files, offering a powerful array of features tailored for businesses, educators, and professionals. With tools to merge, split, and convert PDFs, as well as options to apply password protection and advanced encryption, it ensures both flexibility and security in document management. All-About-PDF supports batch processing, integrates digital signatures, and enables the removal of editing, copying, and printing restrictions, making it a comprehensive choice for managing sensitive files. Its intuitive interface promotes ease of use, while its efficiency saves time and boosts productivity. Whether creating secure contracts, streamlining document workflows, or preparing academic materials, All-About-PDF delivers dependable tools to simplify and protect your document processes.
All-About-PDF offers robust PDF conversion capabilities, equipping software developers with tools to transform PDFs into editable formats such as Word, PowerPoint, and HTML. By eliminating the need for manual content recreation, this functionality streamlines workflows, enabling developers to efficiently adapt existing documents for integration into applications or presentations. It ensures high-quality output by preserving the original formatting and structure, a crucial factor for maintaining professional standards. This support for batch processing allows developers to process multiple files simultaneously, significantly saving time and enhancing productivity in document management tasks.
All-About-PDF is licensed per machine, and is available as a perpetual license. We can supply Internal, External and OEM licenses. See our All-About-PDF licensing page for full details.
For more information, visit our All-About-PDF product page.
電話: (888) 850 9911
Fax: +1 770 250 6199


