


公式サプライヤー
公式および認定ディストリビューターとして200社以上の開発元から正規ライセンスを直接ご提供いたします。
当社のすべてのブランドをご覧ください。
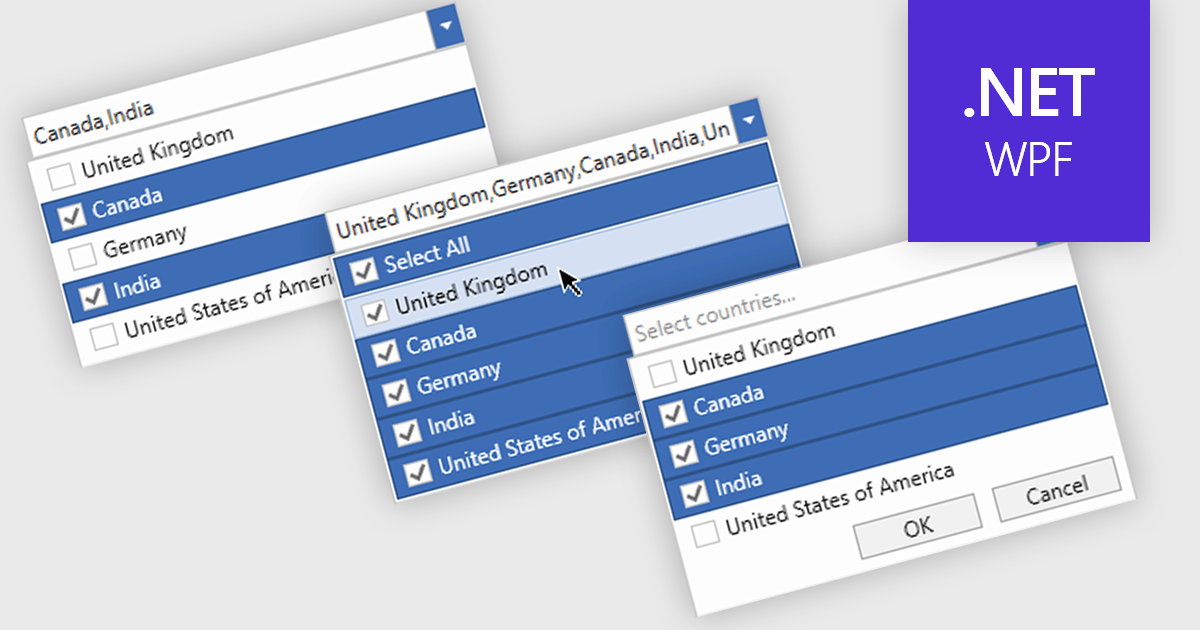
Checked combobox controls are data editor user interface elements that allow users to select multiple options from a dropdown list while visually indicating their choices through checkboxes. These controls provide developers with a convenient way to implement multi-select functionality within their applications, enhancing the user experience by offering intuitive selection methods. By integrating checked combobox controls, developers can streamline data entry processes, improve usability, and increase productivity within their software applications, ultimately leading to more efficient and user-friendly interfaces.
Many .NET WPF Data Editor collections contain checked combobox components including:
For an in-depth analysis of features and price, visit our comparison of .NET WPF Data Editors.
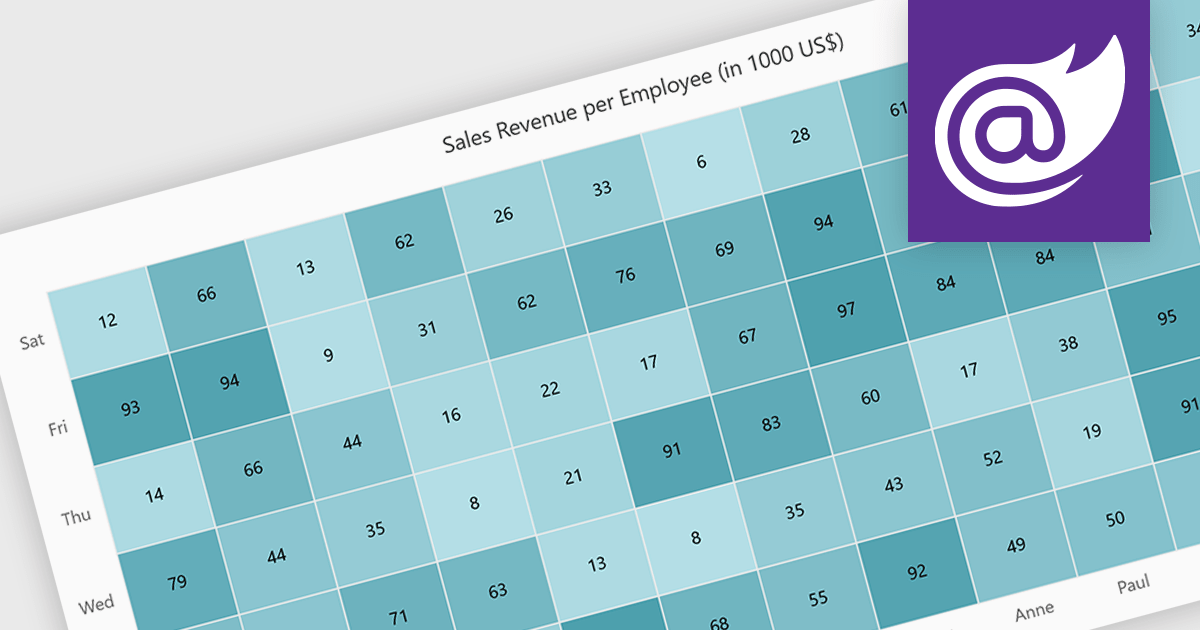
A heatmap is a data visualization tool that uses color intensity to represent magnitude within a dataset. This allows for quick identification of patterns and trends across two variables, depicted on the map's axes. Heatmaps are valuable for analyzing geographic data, user website interaction, and any other scenario where you need to visually grasp the distribution of data points.
Several Blazor chart controls offer Heatmaps including:
For an in-depth analysis of features and price, visit our Blazor chart controls comparison.
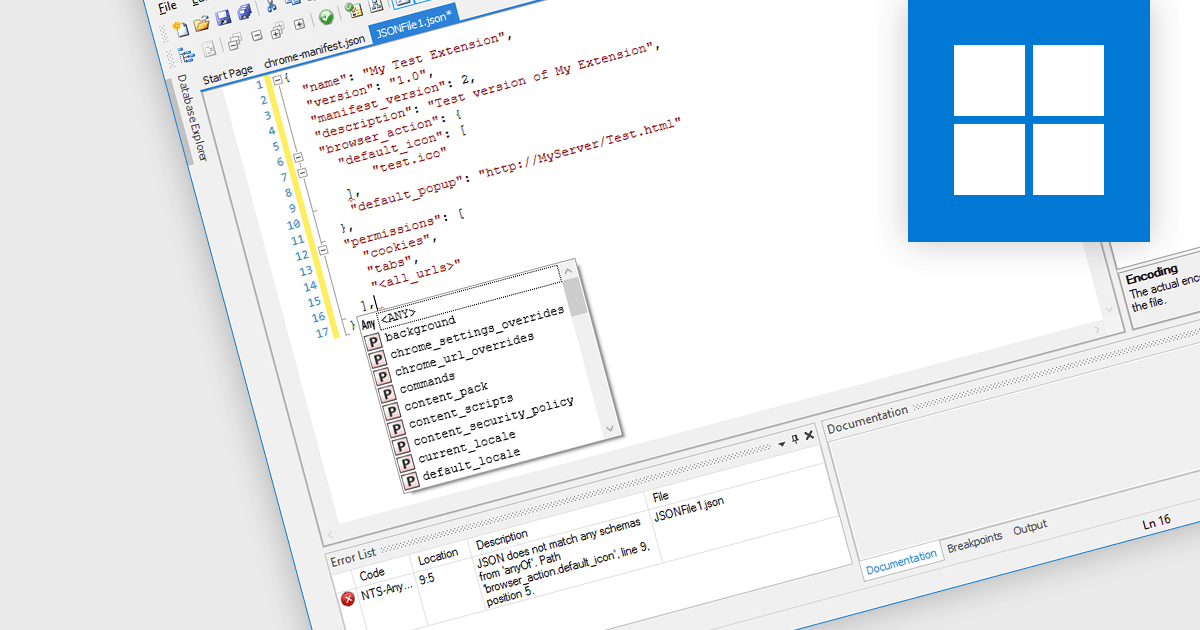
A JSON (JavaScript Object Notation) editor is a specialized tool designed to facilitate the manipulation and modification of JSON data within structured documents. It provides developers with an intuitive interface to directly interact with JSON objects, allowing for seamless editing, validation, and visualization of JSON data embedded within documents.
JSON is frequently used for transmitting data between a server and a client in web applications. JSON's lightweight and human-readable format makes it ideal for transmitting structured data over networks, minimizing bandwidth usage and simplifying data exchange. Widely employed across diverse domains, its platform-agnostic design and broad programming language and framework support contribute to its popularity, serving as a preferred option for facilitating interoperability among various systems and technologies.
Several Structured Document Tools offer JSON editors including:
For an in-depth analysis of features and price, visit our comparison of Structured Document Tools.

Thumbnail navigation in JavaScript PDF Viewers enables users to view miniature previews of pages within a PDF document, typically displayed in a sidebar or grid layout. These thumbnails provide users with a visual overview of the document's content, allowing for quick navigation and selection of specific pages.
Several JavaScript PDF Viewer components offer thumbnail navigation including:
For an in-depth analysis of features and price, visit our comparison of JavaScript/HTML5 PDF Viewer Components.
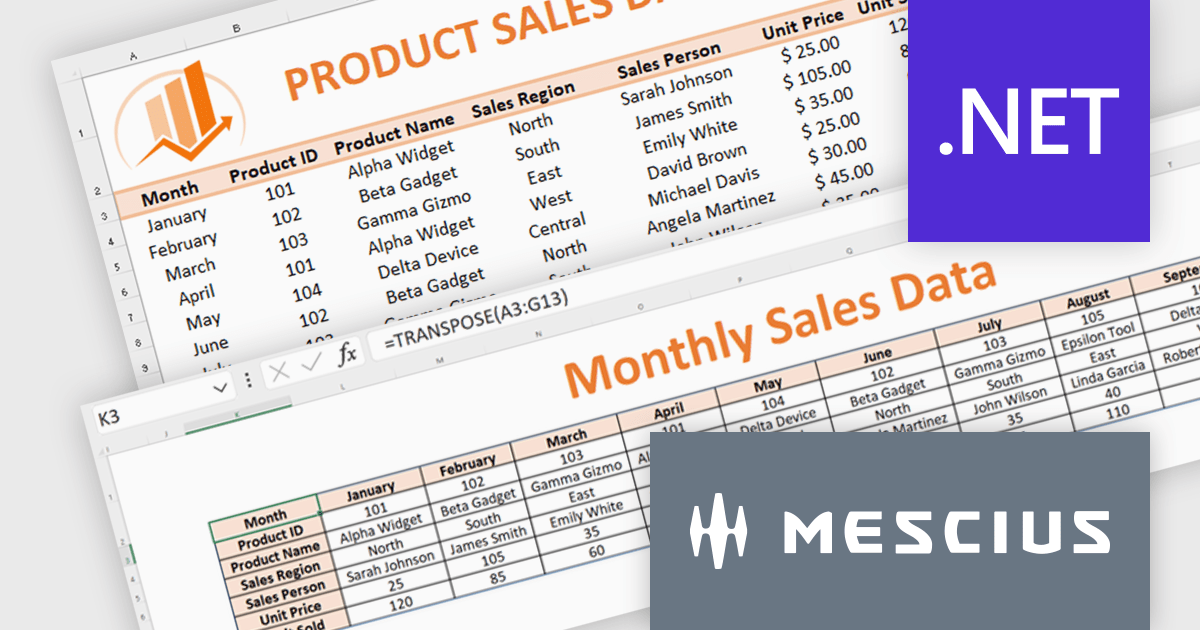
Document Solutions for Excel, .NET Edition (DsExcel, previously GcExcel) is a high-speed, small-footprint, server-side spreadsheet API that requires no dependencies on Excel. With full .NET support, you can generate, load, modify, and convert spreadsheets in .NET, .NET Framework, .NET Core, Mono, and Xamarin. Apps using the spreadsheet API can be deployed to cloud, Windows, Mac, or Linux. Its powerful calculation engine and breadth of features means you'll never have to compromise design or requirements. The interface-based API is modeled on Microsoft Excel's document object model which means you can import, calculate, query, generate, and export any spreadsheet scenario.
Formulas and functions play an important role in data analysis. Microsoft Excel provides a range of functions that simplify the extraction of key metrics during data analysis. In this pair of blog posts from MESCIUS, Software Engineer Prabhat Sharma demonstrates how to use DsExcel to implement Excel functions and other Excel-like functionalities.
Part 1 of the blog shows you how to drill into sales data and integrate the following functions:
Part 2 of the blog digs into monthly budget data to show you how to use:
Document Solutions for Excel is licensed per developer for either one distribution location or unlimited distribution locations. Licenses are perpetual, and include a one year subscription for all software releases (including hotfixes and major releases) plus Platinum Support. See our Document Solutions for Excel, .NET Edition licensing page for full details.
Learn more about Document Solutions for Excel, .NET Edition.
電話: (888) 850 9911
Fax: +1 770 250 6199


