公式サプライヤー
公式および認定ディストリビューターとして200社以上の開発元から正規ライセンスを直接ご提供いたします。
当社のすべてのブランドをご覧ください。

スクリーンショット: Surface plot after customization. Includes many properties to enhance the surface chart; color palette, border, pattern, null values, wire-frame, dots, surface sides, marks, gradients, inverted axes, etc. 0 ...

スクリーンショット: The Subtract function uses more than one series as data source. It calculates for each point the difference between the last and first series. 0 ...

スクリーンショット: TeeChart offers many indicators specifically designed to track financial data. This is a sample of the A.D.X (Average Directional Change) function on Chart. Uses a OHLC (Candle) series as datasource and plots 3 lines: DMI+, ADX and DMI-. 0 ...

スクリーンショット: Sample financial chart created using the MACD function (Moving Average Convergence Divergence). 0 ...

スクリーンショット: Using TeeChart for ActiveX in Visual Studio.NET using Visual Basic. 0 ...

スクリーンショット: Using TeeChart for ActiveX in Visual Studio.NET using Visual C++. 0 ...

スクリーンショット: Using TeeChart for ActiveX in Visual Studio.NET using C#. 0 ...

スクリーンショット: Using TeeChart for ActiveX in Microsoft Office. TeeChart may be coded using VBA. 0 ...

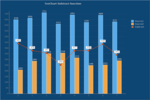
スクリーンショット: The Bar style allows single or multiple bars with different layouts (3D, side-to-side, side-all, stacked, stacked 100%). This is a basic 2D Bar series example with vertical orientation. 0 ...