Vizuly / plexityHide.com - ベストセラー商品
Create highly customized and unique data visualizations.
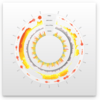
Corona Chart - This radial chart provides angular and curved radial area line curves and supports both an overlap and stacked layout. It also features over a dozen different dynamic styles and comes bundled with an easy to use test container that demonstrates seven uniquely styled themes.
Include sophisticated time management capability in your apps.
- Time blocks can be displayed in a Gantt chart or schema view
- Display dependencies and collisions between times
- Provide end users with a graphical way to view and modify projects
Include sophisticated time management capability in your apps.
- Time blocks can be displayed in a Gantt chart or schema view
- Display dependencies and collisions between times
- Provide end users with a graphical way to view and modify projects
Add fully interactive Gantt and Schedule charts to your applications.
- Supports AJAX with client-movable and resizable time items
- Features asynchronous collision detection and handling of time items
- Security awareness enables deployment on XBAP or ClickOnce
-
説明:
Add interactive Gantt charts to your.NET applications. GTP.NET's overall goal and purpose is to let you visualize and manipulate time based information. GTP.NET includes a collection of user interface components which handle time blocks. The time ...
続きを読む
-
説明:
Interactive Gantt chart and Schedule chart for WPF. GTP.NET for WPF is a component package which helps you with time visualization and interaction. GTP.NET for WPF contains a fully interactive Gantt chart and a fully interactive Schedule chart. GTP.NET ...
続きを読む
-
説明:
Include sophisticated time management capability in your applications. The Gantt time package is a collection of user interface components which handles time blocks. The time blocks are displayed in a Gantt chart or a schema view. The times are connected ...
続きを読む
-
説明:
A radial line and area layout visualization. Vizuly Corona is a radial chart that provides angular and curved radial area line curves and supports both an overlap and stacked layout. It also features over a dozen different dynamic styles and comes bundled ...
続きを読む
-
説明:
Represent transactional relationships from a specified number of sources to a variable number of targets. Vizuly Halo uses several different data visualization techniques to represent transactional relationships from a specified number of sources to a ...
続きを読む
-
説明:
Represent cartesian x/y data within a radial plot. Vizuly Radial Bar is designed to represent cartesian x/y data within a radial plot. It supports both clustered and stacked radial bars Use the interactive style explorer on the left to view different ...
続きを読む
-
説明:
Easily display multi-variate time series information. Vizuly Ring Chart lets you easily display multi-variate time series information. Due to its radial form factor, you can display 3 times the information for a given screen width than you could with a ...
続きを読む
-
説明:
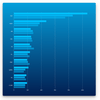
Add stacked and clustered bar charts to your JavaScript apps. Vizuly Bar Chart supports both stacked and clustered layout options, as well as over 2 dozen different dynamic styles. It also comes bundled with a test container and examples of different ...
続きを読む
-
説明:
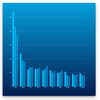
Add stacked and clustered column charts to your JavaScript apps. Vizuly Column Chart supports both stacked and clustered layout options, as well as over 2 dozen different dynamic styles. It also comes bundled with a test container and examples of ...
続きを読む
-
説明:
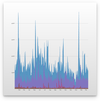
Add line and area charts to your JavaScript apps. Vizuly Line Area Chart supports both line and area plots in several different layout options. It also comes bundled with a test container demonstrating the various chart properties and different style ...
続きを読む


