公式サプライヤー
公式および認定ディストリビューターとして200社以上の開発元から正規ライセンスを直接ご提供いたします。
当社のすべてのブランドをご覧ください。

説明: Add project management features to your JavaScript based applications. DlhSoft Project Management Hyper Framework for JavaScript includes task management and scheduling, working time customization, critical path determination and a simple resource ... 続きを読む

説明: Create animated and interactive charts with hundreds of thousands of data records. ZingChart includes over 50+ built-in chart types and modules that feature interaction with data points and zooming into particular segments. The ZingChart library provides ... 続きを読む

説明: Gantt, Schedule, Load, and PERT Chart components with rich user experience, customizable appearance and behavior, high performance, and printing. DlhSoft Gantt Chart Bundle includes Gantt Chart Light Library for WPF, Gantt Chart Hyper Library for HTML5 ... 続きを読む

説明: A radial line and area layout visualization. Vizuly Corona is a radial chart that provides angular and curved radial area line curves and supports both an overlap and stacked layout. It also features over a dozen different dynamic styles and comes bundled ... 続きを読む

説明: Represent transactional relationships from a specified number of sources to a variable number of targets. Vizuly Halo uses several different data visualization techniques to represent transactional relationships from a specified number of sources to a ... 続きを読む

説明: Represent cartesian x/y data within a radial plot. Vizuly Radial Bar is designed to represent cartesian x/y data within a radial plot. It supports both clustered and stacked radial bars Use the interactive style explorer on the left to view different ... 続きを読む

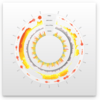
説明: Easily display multi-variate time series information. Vizuly Ring Chart lets you easily display multi-variate time series information. Due to its radial form factor, you can display 3 times the information for a given screen width than you could with a ... 続きを読む

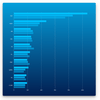
説明: Add stacked and clustered bar charts to your JavaScript apps. Vizuly Bar Chart supports both stacked and clustered layout options, as well as over 2 dozen different dynamic styles. It also comes bundled with a test container and examples of different ... 続きを読む

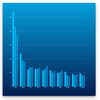
説明: Add stacked and clustered column charts to your JavaScript apps. Vizuly Column Chart supports both stacked and clustered layout options, as well as over 2 dozen different dynamic styles. It also comes bundled with a test container and examples of ... 続きを読む

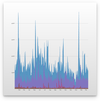
説明: Add line and area charts to your JavaScript apps. Vizuly Line Area Chart supports both line and area plots in several different layout options. It also comes bundled with a test container demonstrating the various chart properties and different style ... 続きを読む