


公式サプライヤー
公式および認定ディストリビューターとして200社以上の開発元から正規ライセンスを直接ご提供いたします。
当社のすべてのブランドをご覧ください。
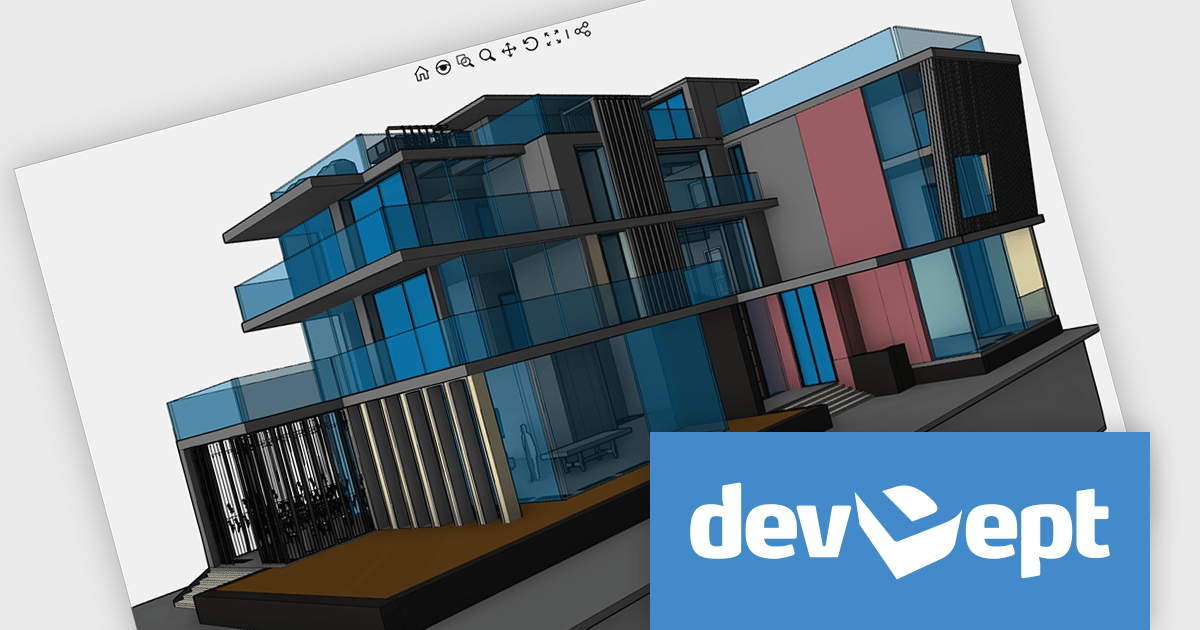
EyeShot by devDept is a comprehensive 3D graphics toolkit designed for .NET developers building engineering and CAD (Computer-Aided Design) applications. It offers a robust set of components for creating, editing, and rendering complex 2D and 3D geometry directly within Windows Forms and WPF environments. With support for advanced modeling features, viewport controls, and industry-standard file formats, EyeShot simplifies the integration of interactive graphics into technical software. It is well-suited for developers working in areas like mechanical design, architecture, and simulation who need high-performance rendering and precise modeling capabilities.
The EyeShot 2025.2 update introduces Shaded VectorView, a major enhancement that replaces the legacy RasterView mode. This new feature enables precise dimensioning directly on shaded views. Shaded VectorView maintains consistent line weights, addressing a long-standing limitation where raster-based views could appear visually inconsistent. By merging the visual fidelity of shaded rendering with the clarity of vector graphics, this upgrade delivers a more unified and production-ready experience for engineers and designers alike.
To see a full list of what's new in version 2025.2, see our release notes.
Eyeshot is licensed per developer and is available as an annual license, with either Lite or Priority support. See our licensing pages for Eyeshot Pro, Eyeshot Ultimate, and Eyeshot Fem for full details.
Eyeshot is available to buy in the following products:
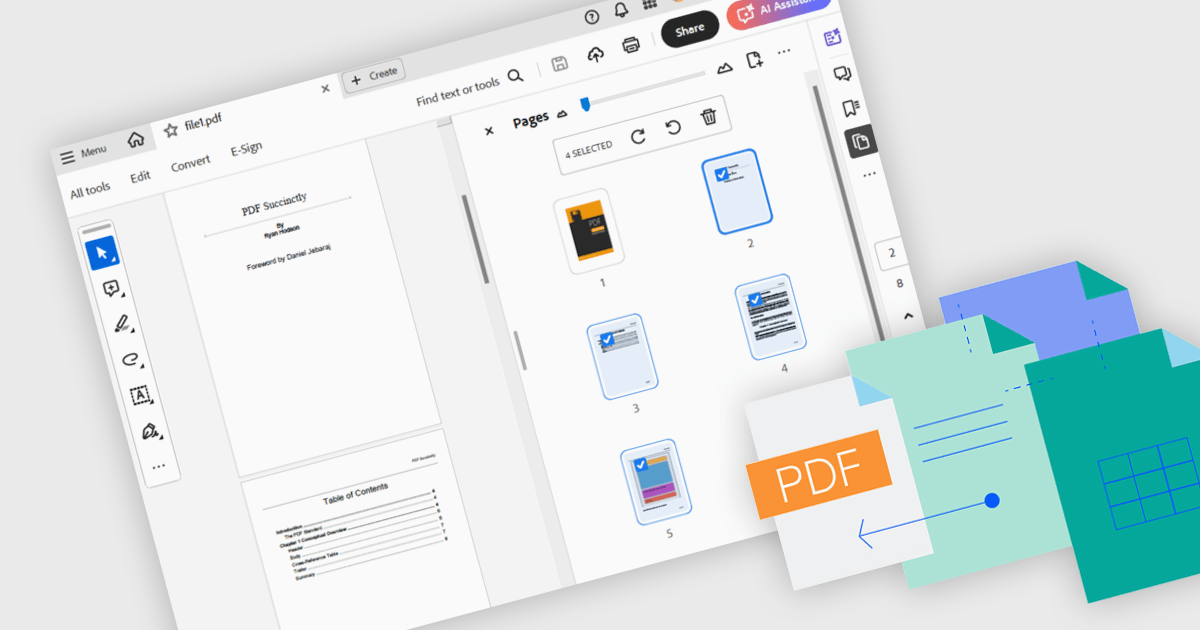
Merging PDFs involves combining two or more separate PDF files into a single cohesive document, preserving the original formatting and quality of each page. This process improves file management by reducing clutter and making it easier to locate and share information, while also minimizing storage overhead. Benefits include consistent headers and footers across pages and simplified collaboration through a single master file for review and annotation. Common use cases include uniting research articles for academic literature reviews, and creating unified project portfolios or client presentations.
Several .NET WPF components offer PDF merging including:
For an in-depth analysis of features and price, visit our comparison of .NET WPF PDF components.
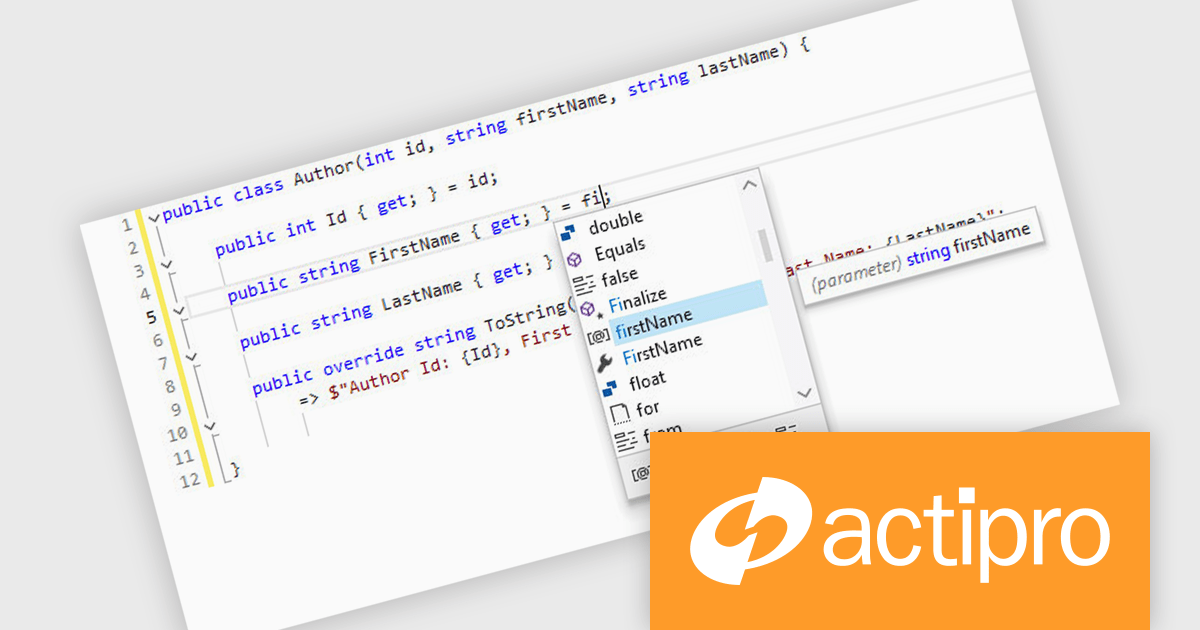
Actipro SyntaxEditor is a sophisticated WPF code editor control designed to provide developers with a seamless way to integrate advanced code editing capabilities into their .NET applications. It offers syntax highlighting for numerous programming languages, code outlining, automated IntelliPrompt (code completion and information tooltips), background parsing, error reporting, and more. This delivers a familiar user experience for developers used to the powerful code editors found in popular IDEs.
The Actipro SyntaxEditor v25.1 update improves the .NET Languages Add-on with full support for C# 13, ensuring every new language construct is parsed correctly and presented accurately in the editor. By incorporating raw string literals, file-scoped namespaces, list patterns, required members and parameter null checking, it allows IntelliSense to provide precise code completions and signature help for the latest API surface. Real-time error detection flags invalid C# 13 syntax, reducing the feedback loop between editing and compilation. Refactoring operations such as renaming, extraction and code generation now understand modern construct semantics to preserve code integrity without manual intervention. This makes it simpler to adopt the most recent C# advancements within any WPF-based IDE or editor.
To see a full list of what's new, see our Actipro SyntaxEditor for WPF release notes.
Actipro SyntaxEditor is licensed per developer and is available as a Perpetual license with 1 year support and maintenance. See our Actipro SyntaxEditor for WPF licensing page for full details.
Actipro SyntaxEditor for WPF is available individually, or as part of Actipro WPF Studio.
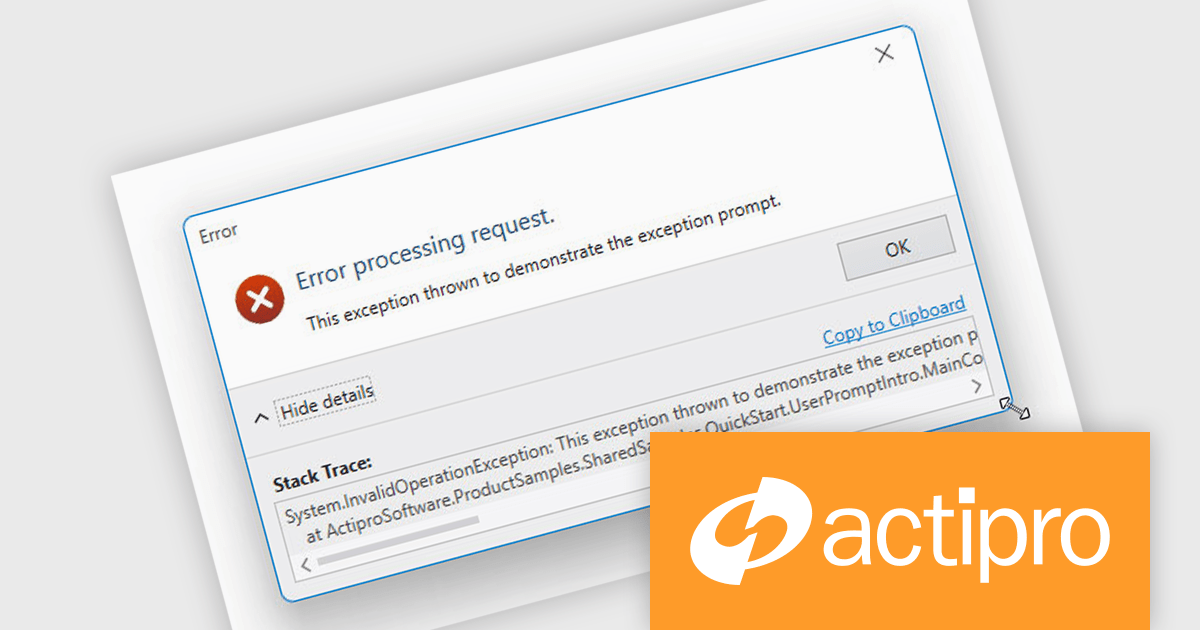
Actipro WPF Essentials is a robust suite of user interface controls designed specifically for Windows Presentation Foundation (WPF) applications. It includes a set of advanced components that enhance the standard WPF experience, focusing on both usability and visual appeal. The product provides developers with high-performance tools such as sophisticated docking windows, property grids, and enhanced controls like task panes and themes, making it easier to build rich, interactive desktop applications.
The Actipro WPF Essentials v25.1 update adds support for resizable user prompts, making it easier to implement adaptable dialog boxes. With just one configuration change, developers can now allow end users to adjust prompt sizes, improving usability and accessibility. This feature removes the need for custom resizing logic and ensures consistent behavior across different applications, supporting more responsive and user-friendly interfaces.
To see a full list of what's new in v25.1, see our release notes.
Actipro WPF Essentials is licensed per developer and is available as a Perpetual license with 1 year support and maintenance. See our Actipro WPF Essentials licensing page for full details.
Actipro WPF Essentials is available in the following products:
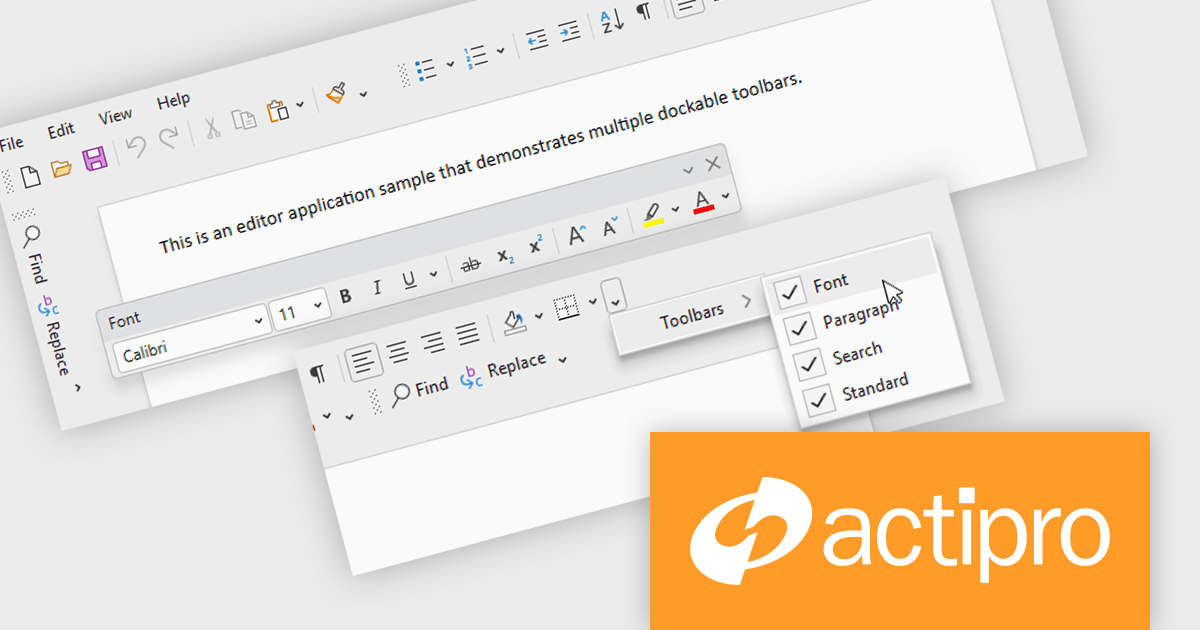
Actipro Bars for WPF is a UI component library that equips developers with the tools to build advanced ribbons, toolbars, and menus within their WPF applications. It offers an "Office-like" ribbon experience with customization options, supports MVVM design patterns, and includes a rich set of controls specifically designed for use within these elements, allowing for a cohesive and user-friendly interface.
The Actipro Bars for WPF v25.1 update introduces Visual Studio-style dockable toolbars that can be positioned on any edge of a host control or detached and moved to secondary monitors. This provides a highly adaptable workspace layout that users can configure to fit their preferences. Developers gain fine control over docking behavior, floating, stacking, and visibility settings through exposed properties, allowing for a dynamic and customizable interface without requiring complex custom coding.
To see a full list of what's new in v25.1, see our release notes.
Actipro Bars for WPF is licensed per developer and is available as a Perpetual license with 1 year support and maintenance. See our Actipro Bars for WPF licensing page for full details.
Actipro Bars for WPF is available in the following products:
電話: (888) 850 9911
Fax: +1 770 250 6199


