


公式サプライヤー
公式および認定ディストリビューターとして200社以上の開発元から正規ライセンスを直接ご提供いたします。
当社のすべてのブランドをご覧ください。
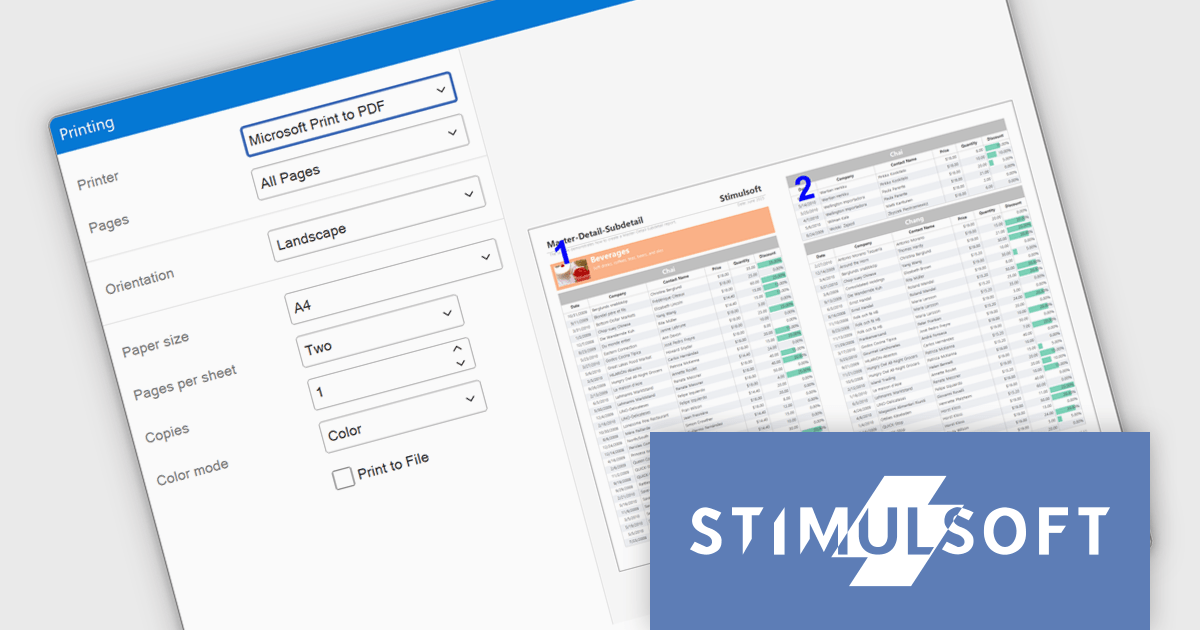
Stimulsoft Reports.WPF is a powerful reporting component for Windows Presentation Foundation (WPF) that provides rich rendering, viewing, printing, and exporting capabilities, allowing users to easily create, customize, and execute complex reports with minimal code, featuring a designer, data binding, WYSIWYG printing, and support for multiple export formats.
The Stimulsoft Reports.WPF 2025.3.1 update introduces a new Extended Print Dialog that enhances the printing experience by offering a customizable print window with built-in report preview. This allows developers to provide users with a clearer view of report layout and formatting before printing, while automatically adjusting available print options based on the installed printer driver. The feature is easy to enable and helps ensure more accurate, efficient, and user-friendly report output.
To see a full list of what's new in 2025.3.1, see our release notes.
Stimulsoft Reports.WPF is licensed per developer and is available as a perpetual license with 1 year support and maintenance. See our Stimulsoft Reports.WPF licensing page for full details.
Stimulsoft Reports.WPF is available in the following products:
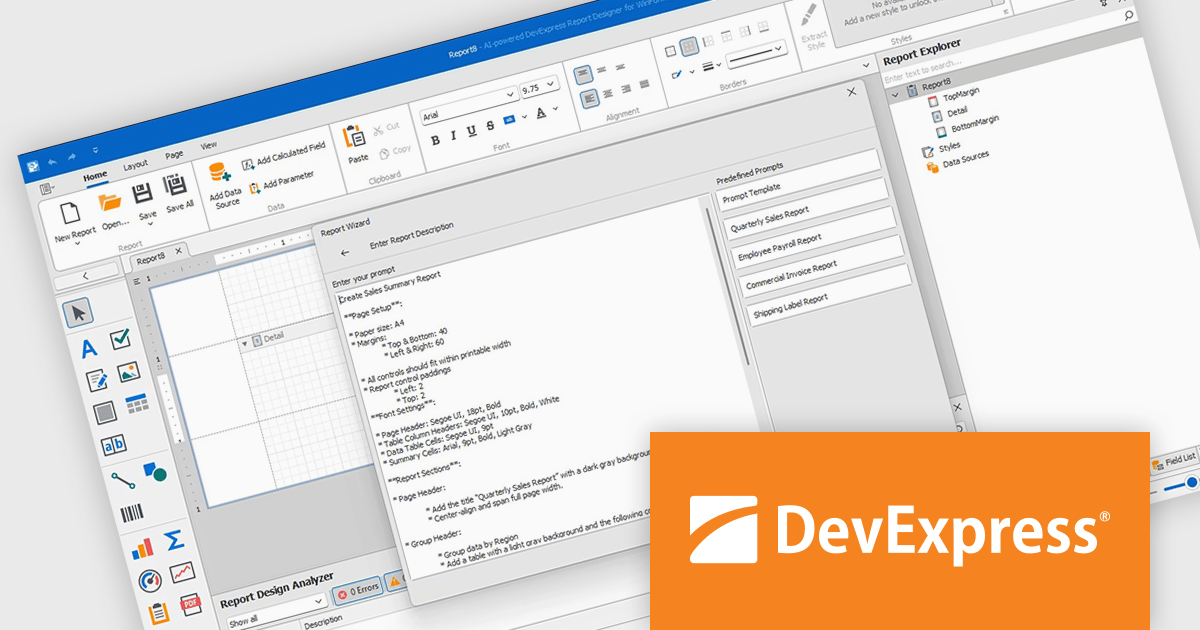
DevExpress Reporting is a comprehensive suite of reporting tools that empowers developers to create visually stunning and highly customizable reports for various applications. With its rich feature set, including data binding, layout design, printing, and exporting capabilities, DevExpress Reporting enables the efficient creation of reports that meet the most demanding business requirements.
The DevExpress Reporting v25.1 update introduces a new AI-powered Report Wizard (currently in Community Technology Preview), bringing natural language capabilities directly into the report design workflow. By allowing users to describe the report they need in plain text, the wizard interprets this input and automatically generates a matching report layout. This greatly reduces the time and expertise required to design reports, particularly for users who may not be familiar with the underlying report schema or expression syntax. It’s especially useful for quickly prototyping reports or enabling non-technical users to contribute to report design without writing code or manually configuring elements.
To see a full list of what's new in version 25.1, see our release notes.
DevExpress Reporting is licensed per developer and is available as a Perpetual License with a 12 month support and maintenance subscription. See our DevExpress Reporting licensing page for full details.
DevExpress Reporting is available to buy in the following products:
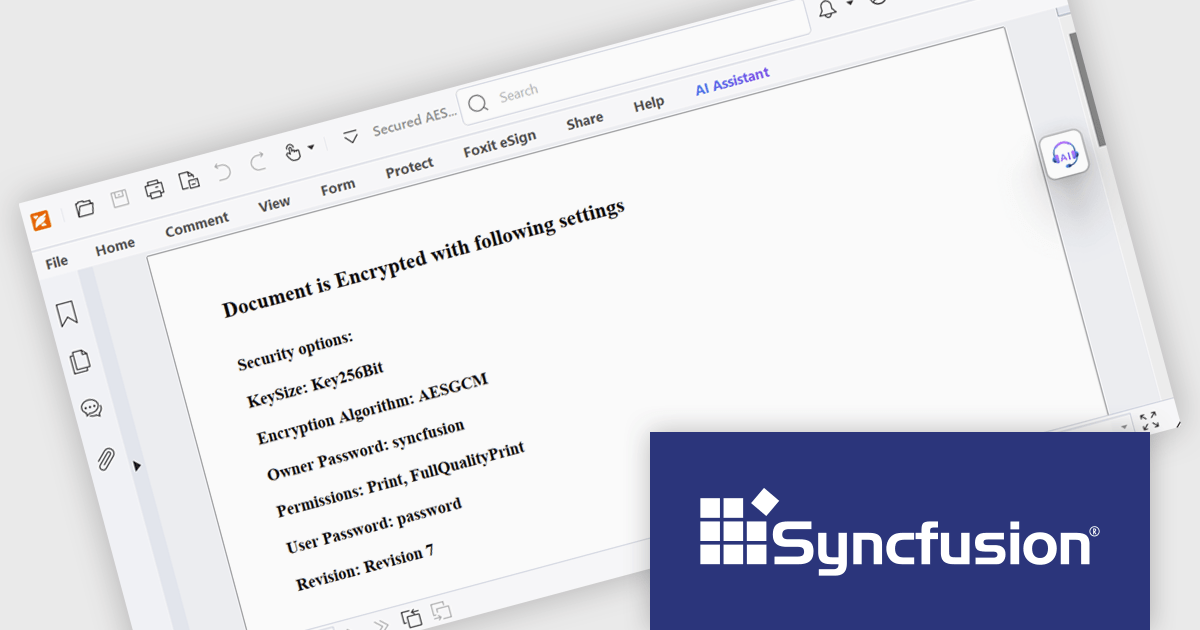
Syncfusion Essential Studio WPF (available as part of Syncfusion Essential Studio Enterprise) is a powerful suite of over 95 UI controls, 50+ charts, and document processing libraries designed to boost the development of high-performance line-of-business applications for the Windows Presentation Foundation (WPF) framework. With built-in themes, touch-friendly interfaces, and seamless Visual Studio integration, it empowers developers to craft modern, feature-rich, and cross-platform experiences with ease.
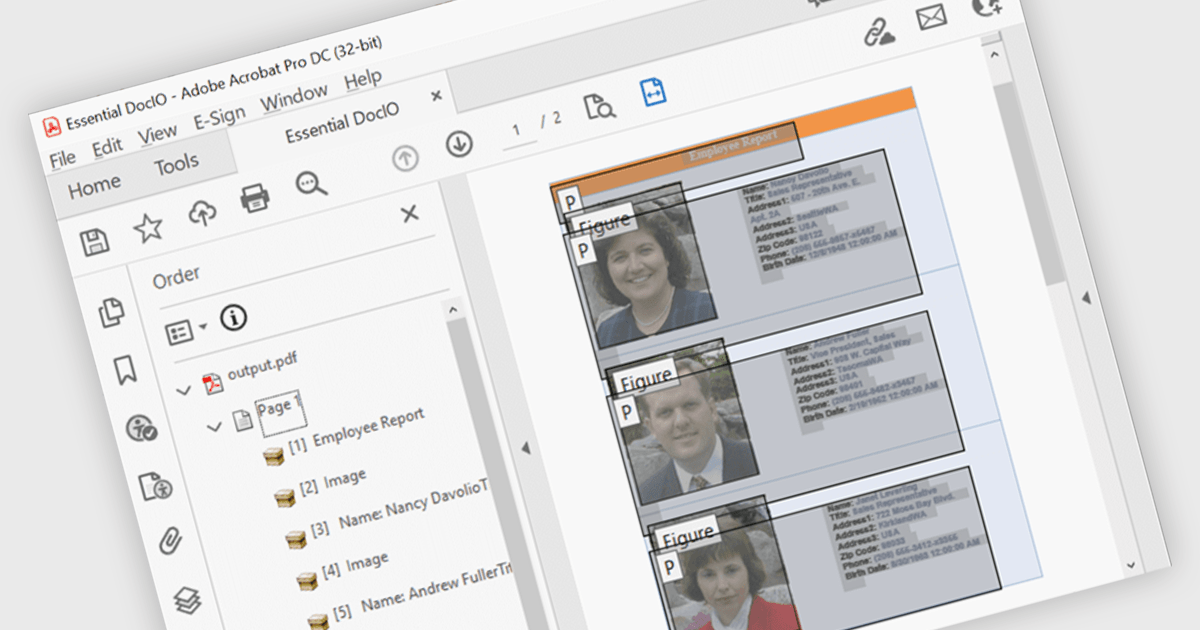
The Syncfusion Essential Studio WPF 2025 Volume 2 update introduces AES GCM encryption support for PDF documents, giving developers a reliable and efficient way to implement modern, standards-based security in their applications. This enhancement allows for both encryption and decryption of PDFs using a cryptographic method that ensures data confidentiality and integrity, making it easier to comply with industry regulations and safeguard sensitive content. By integrating AES GCM, developers can build secure document workflows with performance-optimized encryption that is widely supported across current platforms and environments.
To see a full list of what's new in 2025 Volume 2, see our release notes.
Syncfusion Essential Studio WPF is available as part of Syncfusion Essential Studio Enterprise which is licensed per developer starting with a Team License of up to five developers. It is available as a 12 Month Timed Subscription License which includes support and maintenance. See our Syncfusion Essential Studio Enterprise licensing page for full details.
Learn more on our Syncfusion Essential Studio WPF product page.
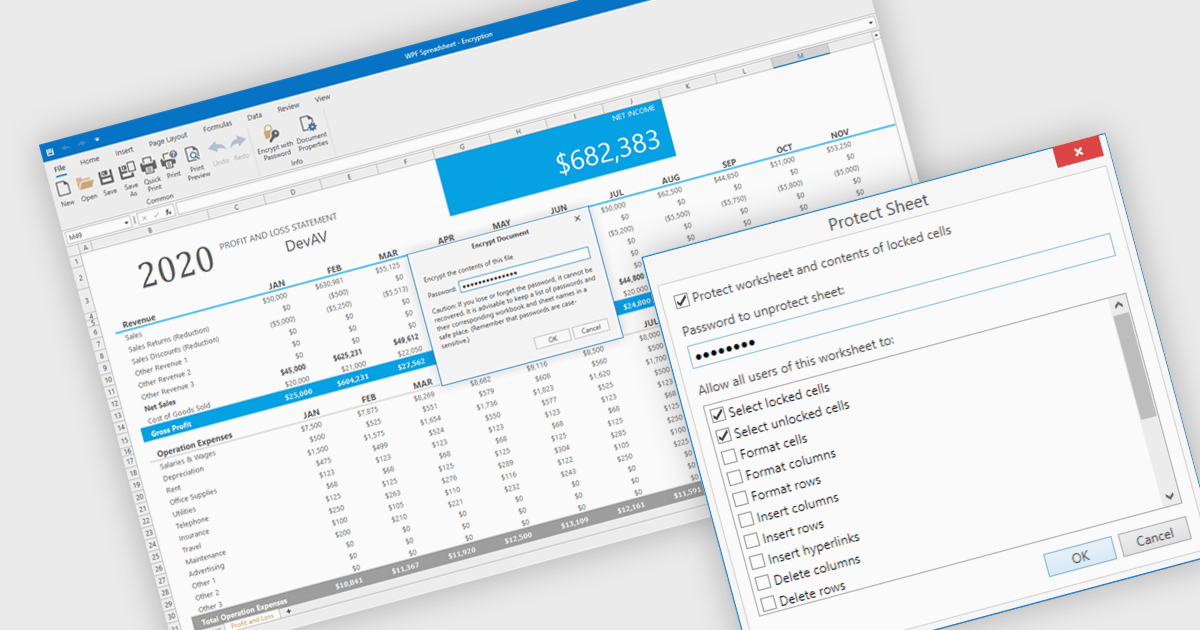
Spreadsheet security features are essential tools designed to protect sensitive data, ensure data integrity, and control user access within spreadsheet applications. These capabilities typically include such measures as password protection or cell locking, and are used to prevent the unauthorized viewing or modification of content in the spreadsheet. Implementing security measures in their spreadsheets allows organizations to maintain compliance with data security standards or data governance policies, and avoid accidental or malicious data loss or alteration. This level of control is particularly important in environments where multiple users collaborate on financial models, project plans, or other critical datasets.
Several WPF spreadsheet components offer security features, including:
For an in-depth analysis of features and price, visit our comparison of WPF spreadsheet components.
Accessibility support in PDF components enables developers to produce documents that are easier to navigate for users who rely on assistive technologies. These enhancements include automated tagging for headings, lists, and tables, improved support for screen readers, and logical reading order preservation. By integrating features that align with standards like WCAG and PDF/UA, modern PDF libraries help ensure that documents are not only visually accurate but also semantically rich. This allows developers to meet accessibility requirements with greater ease, particularly in sectors where compliance and usability are essential.
Several .NET WPF PDF components feature accessibility support, including:
For an in-depth analysis of features and price, visit our comparison of .NET WPF PDF components.
電話: (888) 850 9911
Fax: +1 770 250 6199


